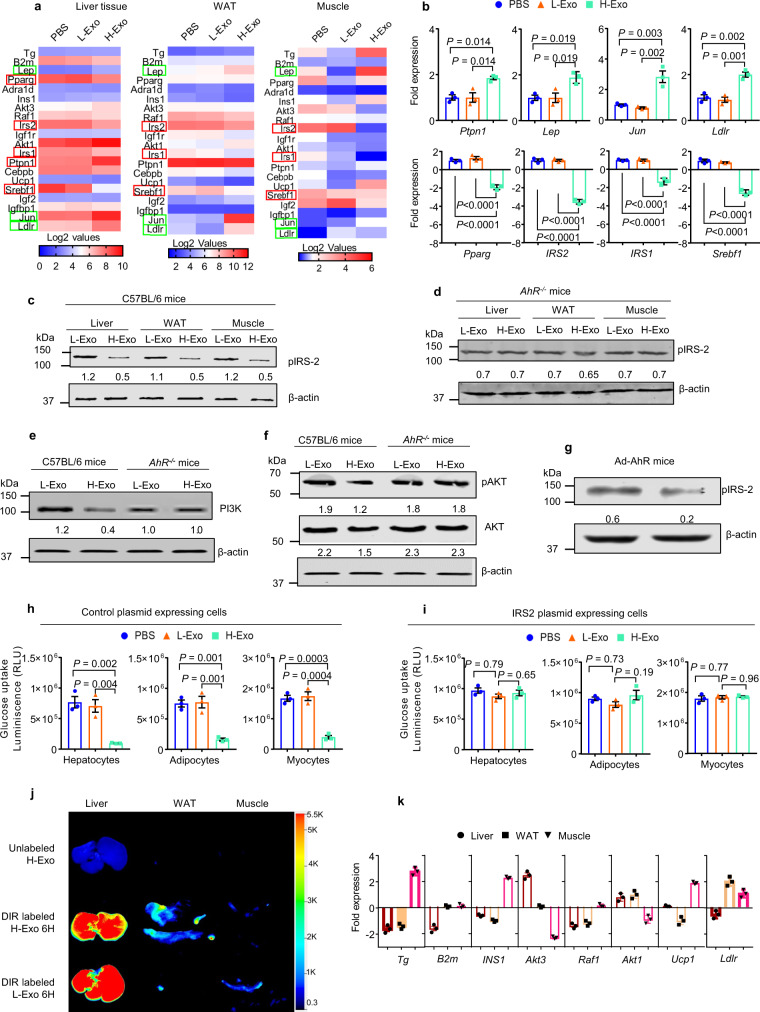
Fig. 6. H-Exo impact on insulin signaling in liver, adipose, and muscle tissues.
a Gene expression heat map from the insulin-signaling PCR array (Qiagen) performed for liver, adipose, and muscle tissues derived from mice receiving 14 days of oral administration of CD63+A33+ exosomes. b Upregulated or downregulated genes in liver tissues derived from mice treated with PBS, L-Exo. and H-Exo (n = 3). Filled circle—PBS, filled triangle—L-Exo, and filled rectangle—H-Exo. c, d Western blots of pIRS-2 in liver, adipose, and muscle tissue extracts from C57BL/6 (c) and AhR−/− mice (d). Ratio to β-actin shown in the middle. e, f Western blots of PI3K, pAKT and AKT in liver tissue extracts from C57BL/6 and AhR−/− mice. Ratio to β-actin shown in the middle as numbers. g AhR was re-expressed in the liver via tail injection of Ad-AhR (adenovirus). Mice were treated with L-Exo or H-Exo for 14 days. pIRS-2 levels measured in liver lysates by western blot. Ratio to β-actin shown in the middle as numbers. h, i Glucose uptake measured in tissue extract-treated hepatocytes, adipocytes, and myocytes transfected with either control (h) or IRS2 (i) plasmid vectors (n = 3). j Scanning images of liver, WAT, and muscle for DIR-labeled exosomes. k Tissue-specific and H-Exo-dependent alteration in the expression of genes regulating insulin signaling. Expressions are shown in comparison with PBS-treated mice (n = 3). Circle—liver, rectangle—WAT, and downward triangle—muscle. Data are presented as the mean ± SD. One-way ANOVA with a Tukey post hoc or two-way ANOVA with a Tukey post hoc test. Source data are provided as a Source Data file.

