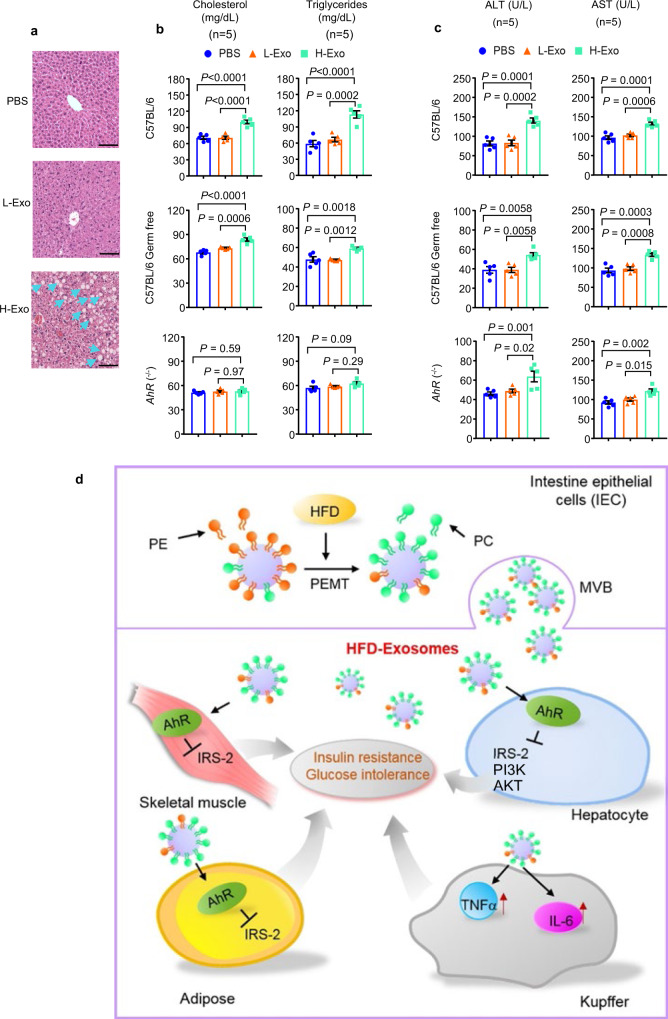
Fig. 7. H-Exo induced liver steatosis and dyslipidemia in C57BL/6 and C57BL/6 germ-free mice, but not in AhR−/− mice.
a H&E staining of liver tissue sections of mice receiving PBS, L-Exo, or H-Exo for 14 days. Blue arrows indicate steatosis. The scale bar is 20 μm. Data were repeated at least three times. b Plasma cholesterol and triglyceride levels after exosome treatment for 14 days (n = 5). Filled circle—PBS, filled triangle—L-Exo, and filled rectangle—H-Exo. c Plasma ALT and AST levels (n = 5). d Model: The intestinal epithelial cells of HFD-fed mice-release CD63+A33+ exosomes that induce insulin resistance and glucose intolerance via an AhR-mediated pathway. Data are presented as the mean ± SD. One-way ANOVA with a Tukey post hoc test. Source data are provided as a Source Data file.

