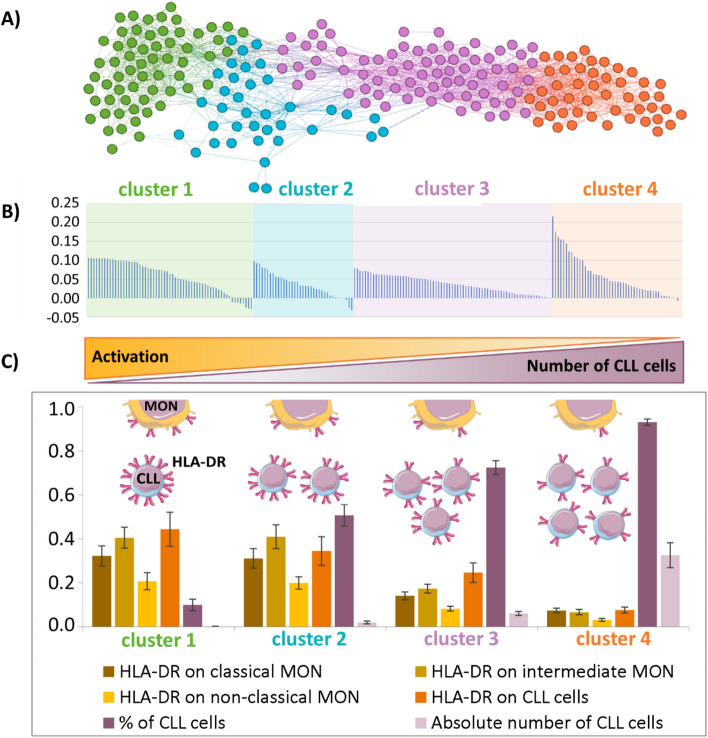
Figure 2.
Patient Similarity Network (PSN) analysis of CLL patients based on the CLL cell bulk and activation of immune cells. (A) PSN shows the distribution of CLL patients into four clusters, according to percentage and CLL cell counts and the expression of HLA-DR on CLL cells and subsets of monocytes (classical, intermediate, non-classical MON). Individual clusters are coloured. Each node corresponds to one patient. Lines connect patients with the highest similarity of expression/cell count profiles. (B) The silhouette of clustered patients in the acquired PSN shows high positive values, indicating that the patients were unambiguously assigned to a cluster far from the boundary between two adjacent clusters; the presence of negative values indicates patients who may also be included in another cluster. (C) Characteristics of obtained clusters revealed by PSN. The y-axis in the graph shows the average values of the used markers/cell counts normalised to the maximum value in the data set. The whiskers represent confidence intervals.

