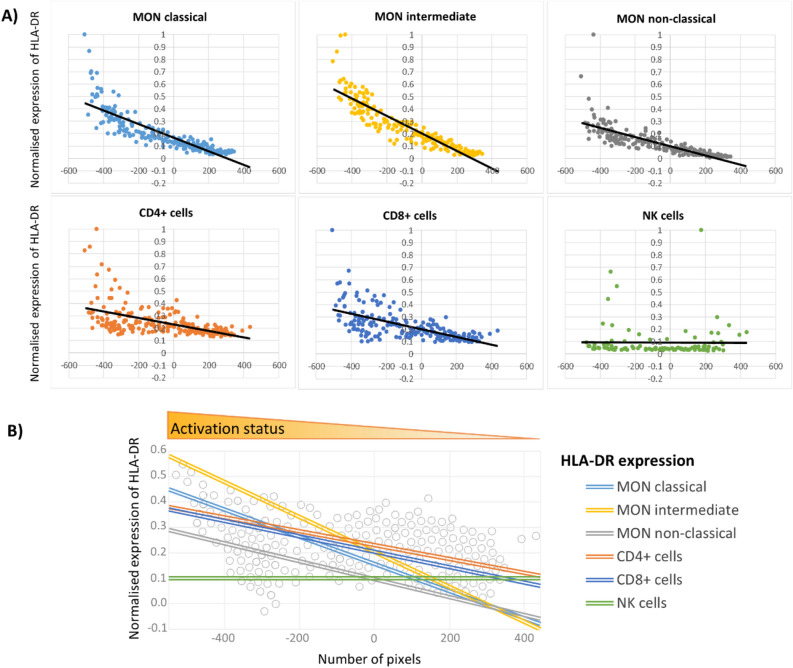
Figure 4.
(A) Trend analysis of HLA-DR expression on monocyte (MON) subsets, CD4+ lymphocytes, CD8+ lymphocytes, and NK cells in PSN layout (presented in Fig. 3A). The y-coordinate of each dot in a scatterplot represents the expression value of studied markers in an individual patient. Values of all parameters were normalised to a maximum of 1 (the highest value in the data set). (B) Comprehensive visualisation of HLA-DR expression trends throughout the whole PSN. The unit on the x-axis is a pixel. The lines show the linear trend of the investigated parameter(s) obtained from scatterplots data.

