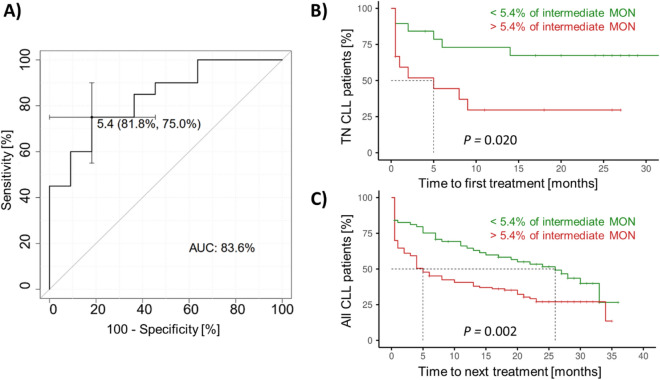
Figure 7.
Predictive potential of intermediate monocyte percentage in CLL patients. (A) ROC curve for treatment-naïve patients sampled at the diagnosis, subdivided according to the treatment requirement during the post-sampling follow-up. K–M curves show time-to-treatment (B) in groups of newly diagnosed treatment-naïve (TN) CLL patients and (C) validation cohort of CLL patients in all stages of the disease. The green curves show patients with a low percentage of intermediate MON, while the red curves show patients with more than 5.4% of intermediate MON.

