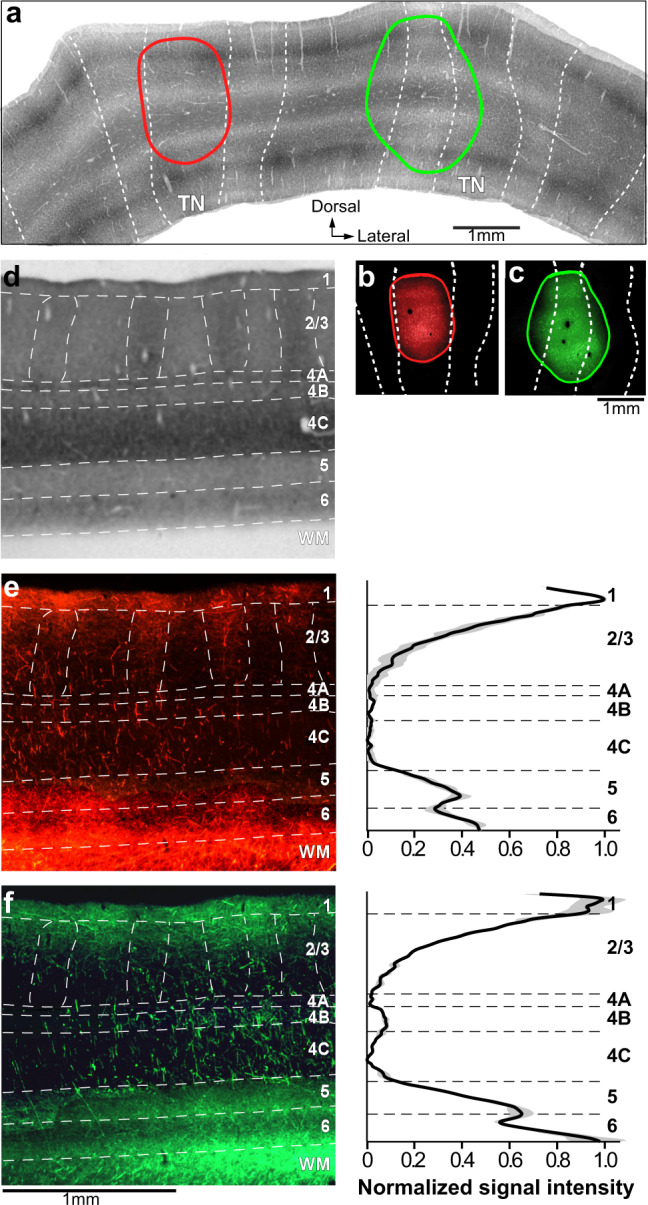
Fig. 1. Laminar distribution of V2 feedback projections to V1.

Case MK359LH. a Micrograph of a merged stack of V2 sections stained for CO, to reveal the stripes (delineated by dashed white contours). Red and green ovals are the composite outlines of an AAV9-tdT and AAV9-GFP injection site, respectively, taken from (b, c) and overlaid onto the V2 CO stack. TN: thin stripes. b, c Micrographs of representative AAV9-tdT and AAV9-GFP injection sites taken under fluorescent illumination. While the images are from a single tissue section, the red and green outlines mark the full extent of the injection sites through the layers, and were generated by aligning images of injection sites through the depth of the cortex. d Image of CO-stained section through the layers of V1 (indicated on the right side). White dashed contours delineate layer boundaries, and the CO blobs in L2/3. The same tissue section, but imaged for fluorescent label, is illustrated in (e) and (f). e Left: Image of tdT-labeled FB axons through V1 layers resulted from the thin stripe injection shown in panels (a, b). Right: Population mean (solid line) ± s.e.m. (gray shading) of normalized fluorescent signal intensity across V1 layers following thin stripe injections (n = 2). f Same as (e) but for FB label resulted from injections (n = 2) that were centered on a pale-lateral stripe, but spilled into adjacent thick and thin stripes. Statistical analysis of differences between stripe types is reported in the “Results”. Scale bar under left panel in (f) is valid for (d) and left panels in (e, f). Results in (a–d), and left panels in (e, f) are representative of four independent injections centered in thin (n = 2) or pale (n = 2) V2 stripes. Source data for right panels in (e, f) are provided as a Source data file.
