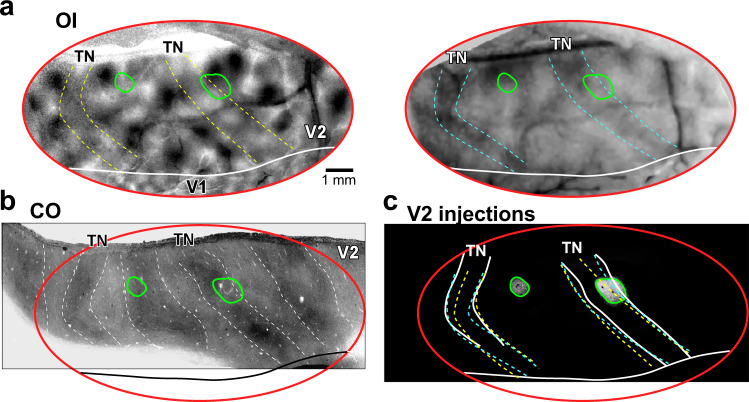
Fig. 3. Injection sites in V2 thick and thin stripes.
Case MK356RH. Two AAV9-GFP injection sites, one confined to a V2 thick stripe, the other to a thin stripe. a Orientation (45–135°; left) and SF (low-high; right) difference maps in V2. Dashed contours delineate regions having weak orientation responses (yellow), and preferring low SFs (cyan), corresponding to thin stripes; solid white contour: V1/V2 border based on the orientation map.b Stack of aligned and merged tangential V2 tissue sections stained for CO, revealing the stripe pattern. Red oval: imaged region from (a), determined based on the same alignment procedure described for a different case in Supplementary Fig. 1. Dashed white contours outline the TN and thick stripes; solid black contour: V1/V2 border based on the orientation map. c Micrographs of the two AAV9-GFP injection sites taken under fluorescent illumination and outlined, with superimposed outlines of TN stripes based on CO (white) and OI maps (yellow, orientation, cyan, SF). Note the good correspondence between functionally-defined and CO-defined stripes. The outlines of the injection sites (green ovals) indicate the location of the injection sites on CO sections (b) and OI (a) maps. These injection sites in (a–c) are representative of six independent injections centered in thin (n = 3) or thick (n = 3) V2 stripes.

