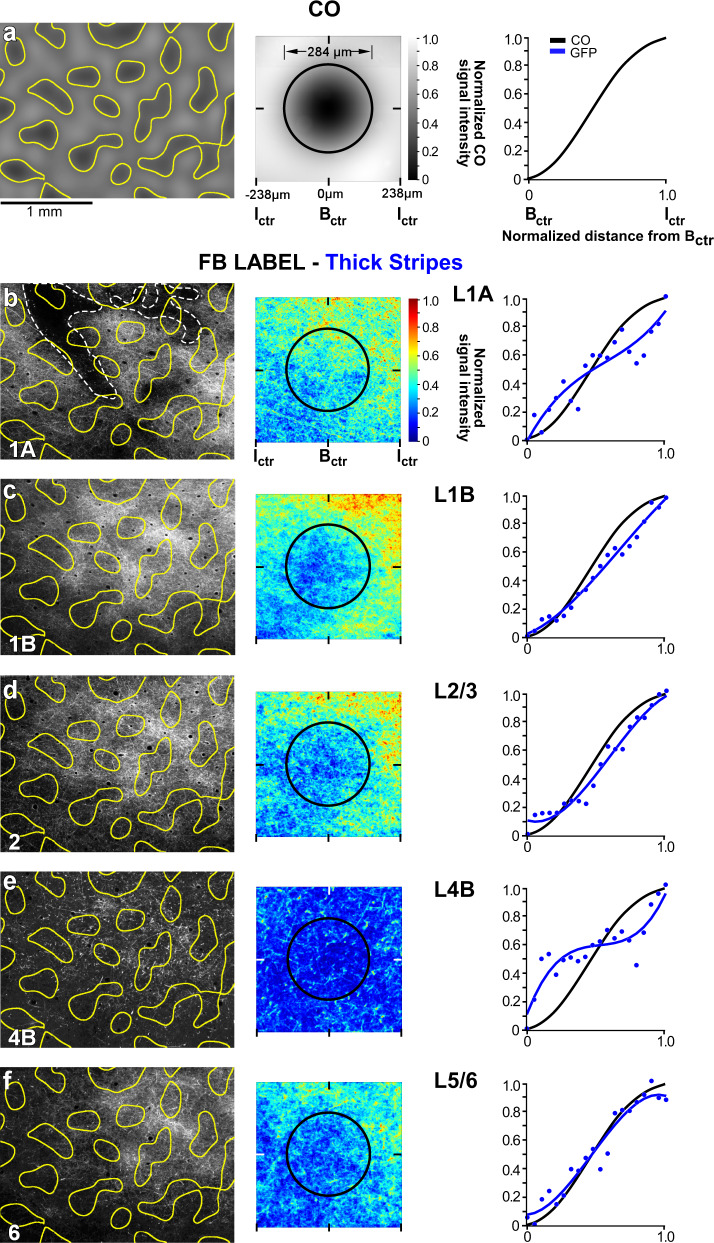
Fig. 4. V2 thick stripes project to V1 interblobs.
Case MK356RH. GFP-labeled FB axons in V1 after the thick stripe injection shown in Fig. 3. a Left: filtered CO map from a section through V1 L2. Segmenting out the darkest 33% of pixels outlines the CO blobs (yellow). Scale bar valid also for (b–f, left). Middle: heatmap of CO signal intensity, generated by measuring CO intensity within a 476 µm2 ROI centered around each blob, then summing all ROIs and normalizing to maximum intensity (see “Methods” and Supplementary Fig. 3a, b). The average blob diameter (black circle) for this case was 284 µm. Right: normalized CO signal intensity as a function of distance from the blob center (Bctr), computed from the CO heatmap, as described in the “Methods” and Supplementary Fig. 3b, e. CO intensity is darkest in the Bctr and brightest in the interblob center (Ictr). The black CO-intensity curve is repeated on each plot in (b–f, right) for comparison with the FB-label intensity curves. (b–f) Left: GFP-labeled FB axons in different V1 layers (indicated at the bottom left corner) with superimposed the blob outlines (yellow) from (a, left). Dashed white lines in (b) outline the pial vessels. MIDDLE: heatmaps of the GFP-label intensity for each layer, generated by measuring fluorescent signal intensity within an ROI centered on each blob overlaying the FB label in that layer, summing all ROIs, and normalizing to maximum intensity. The size of the ROI in each layer is the average blob and interblob size within the FB termination zone in that layer (see “Methods” and Supplementary Fig. 3a, c). Black circles: average blob diameter for that layer. Right: plots of normalized CO (black curves) and GFP-fluorescence (blue curves) intensities as a function of distance from the Bctr, computed as described in the “Methods” and Supplementary Fig. 3b, d, e. Here and in Figs. 5–7 right, the data were fitted with the following function: y = ax3 + bx2 + cx + d. In all layers, GFP-label intensity dominates in the interblobs. Results in (a–f) are representative of three independent injections centered in thick stripes. Source data for right panels in (a–f) are provided as a Source data file.

