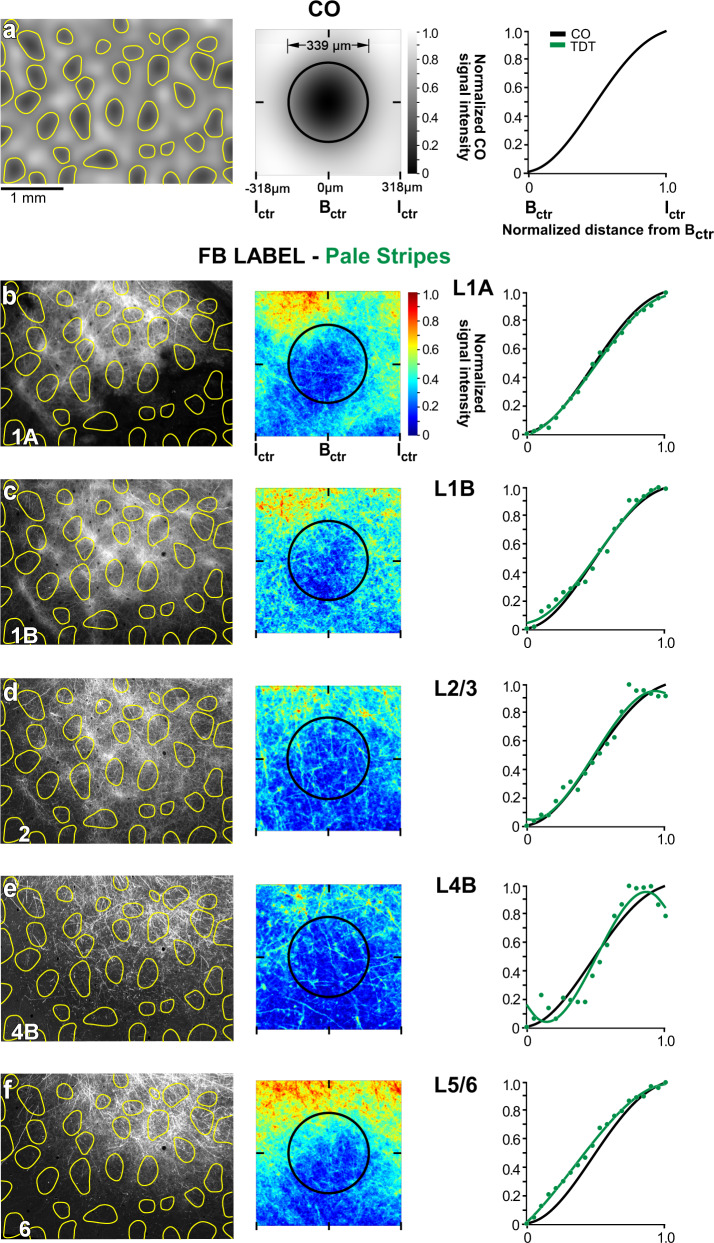
Fig. 6. V2 pale stripes project to V1 interblobs.
Case MK374RHLat. Same as in Fig. 4, but for tdT-labeled FB axons in V1 resulting from the AAV9-tdT injection site confined to a pale-medial stripe shown in Fig. 2a–c. In all layers, GFP-label intensity dominates in the interblobs. Results in (a–f) are representative of three independent injections centered in pale stripes. Source data for right panels in (a–f) are provided as a Source data file.

