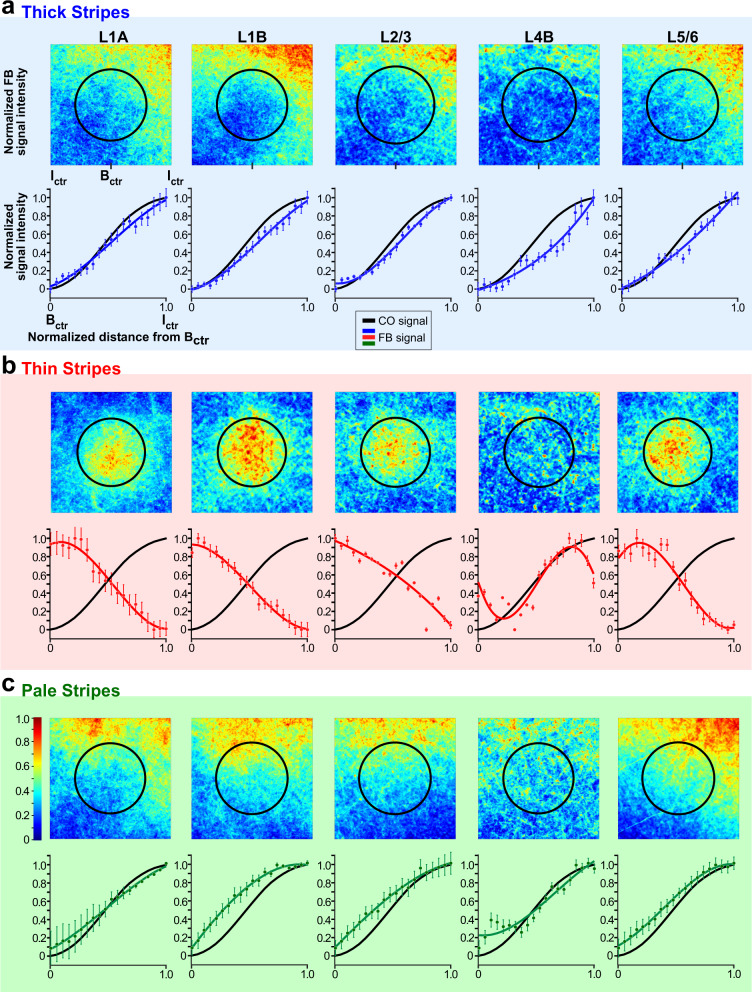
Fig. 7. Population analysis.
Mean heatmaps of fluorescent signal intensity (top panels), and plots of fluorescent and CO signal intensities (bottom panels) for the population of FB projections arising from a V2 thick stripes (n = 3), b thin stripes (n = 3), and c pale stripes (n = 3). For details of how the population means were computed see “Methods”. Error bars in the fluorescent signal intensity plots are s.e.m. Statistical analysis of differences between stripe types are reported in the “Results”. Conventions are as in Fig. 4. Source data for bottom panels in (a–c) are provided as a Source data file.

