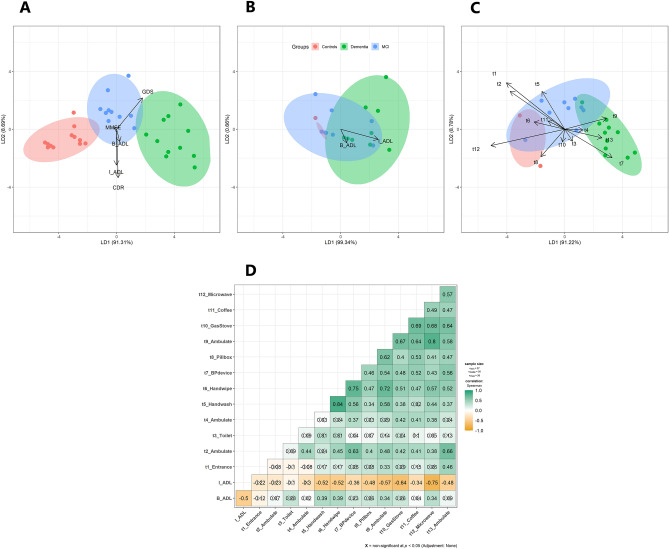
Figure 2.
The results of LDA and correlation analysis. (A) Biplot of LDA with 5 clinical scales as predictors(MMSE, CDR, GDS, B-ADL, I-ADL). (B) Biplot of LDA with 2 ADL clinical scales as predictors(B-ADL, I-ADL). (C) Biplot of LDA with 13 experimental ADL tasks used in this study(“t1” = task1. predictor variables; task1 + task2 + …. + task13). (D) The Spearman's correlation between the total task success frequency and the clinical ADL scales.

