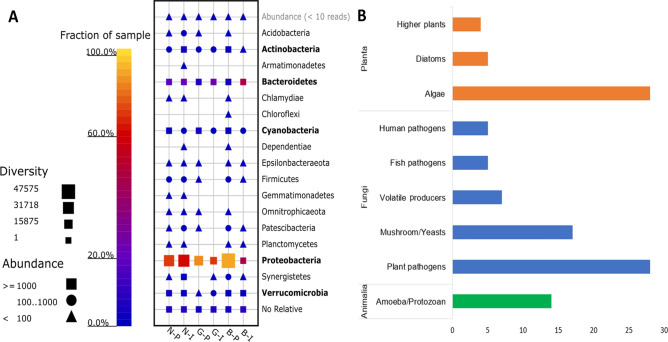
Figure 1.
Microbial diversity detected by the metabarcoding analysis. The relative abundance of identified bacterial OTUs among the six water samples, where top abundant bacterial phyla are written in bold (A). The histogram plot shows the identified eukaryotic groups per domain (Planta, Fungi, or Animalia). The target group in the eukaryotic metabarcoding analysis was the fungal group distributed according to their prominent role and function (BBMerge–accurate paired shotgun read merging via overlap).

