Figure 3.

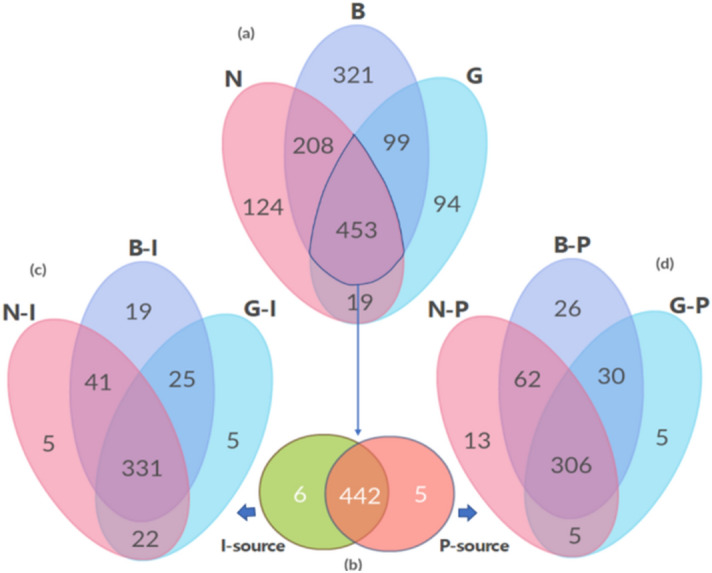
Venn diagram of shared and uniquely identified OTUs among the three sampling locations (a), where the common OTUs were counted by source (I or P; b). For each source, OTUs were separated by sample locations, respectively (c & d).

Venn diagram of shared and uniquely identified OTUs among the three sampling locations (a), where the common OTUs were counted by source (I or P; b). For each source, OTUs were separated by sample locations, respectively (c & d).