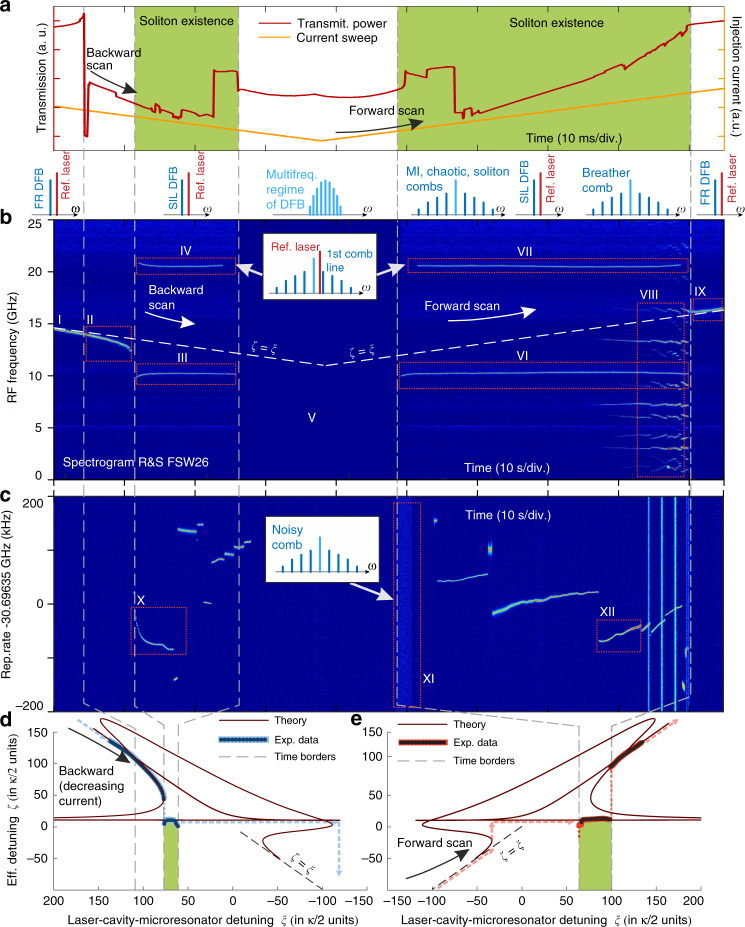
Fig. 4. Soliton formation dynamics with nonlinear laser self-injection locking.
a Microresonator transmission trace in backward and forward scans, at 30 Hz scan rate. b Spectrogram of the beatnote signal between the DFB and the reference laser. c Evolution of the soliton repetition rate around 30.6G Hz. d, e Measured nonlinear ζ(ξ) tuning curve and the theoretical fit. The model parameters: normalized pump amplitude f = 13.1, the locking phase ψ0 = −0.27π and the locking coefficient K0 = 1464. a–d The gray dashed lines correspond to the time borders of different regimes in backward and forward scans. Frames with Roman numerals show different regions of the spectrogram and correspond to the different states of the laser and of the soliton comb: I—free-running laser diode; II—laser diode is locked to the microresonator but the locking is weak and the Kerr comb does not form; III, VI—soliton self-injection locking; IV, VII—the beatnote signal of the 1st comb line and Ref. laser; V—multi-frequency region of laser diode operation (manually truncated); VIII—breather soliton state; IX—free-running laser; X, XII—the soliton rep. rate beatnote signal; XI—chaotic comb.

