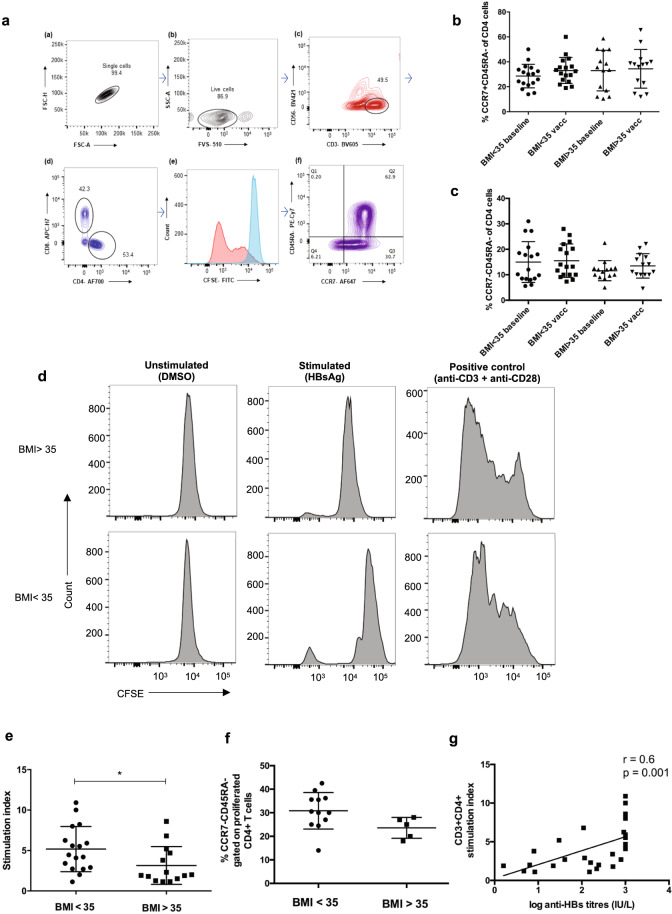
Fig. 3. Immunophenotyping of CD4+ memory T cells and proliferation.
A Gating strategy for T cells. B Proportion of circulating central memory cells (TCM, CCR7+ CD45RA−). C Proportion of circulating effector memory cells (TEM, CCR7− CD45RA−) gated on live CD3+ CD56− CD4+ cells at baseline and after vaccination in NAFLD patients. The data show no differences in the percentage of the cells at baseline and post vaccination between low and high-risk obesity NAFLD cases (Krushkal–Wallis test). D Representative CFSE proliferation assays from a low (showed proliferation) and high risk patient (who did not show proliferation) using PBMC. Every sample was cultured in triplicates with DMSO controls, HBsAg stimulated cells (5 µg) for ~8 days and positive control anti-CD3 (1 µg/mL) + anti-CD28 (5 µg/mL) beads for 4 days. E Stimulation index (SI) in low risk vs. high-risk cases: high risk obesity class NAFLD patients showed weaker T cell proliferation compared to low-risk patients, p = 0.02 (Mann–Whitney U test). F Proportion of effector memory cells among the proliferated CD4+ T cells: TEM frequencies between 12 low-risk and 5 high-risk obesity patients that showed HBsAg specific T-cell proliferation were comparable (Mann–Whitney U test). Data are presented as mean ± standard deviation. G Correlation between anti-HBs levels, IU/L and CD4+ T cell stimulation index: Spearman’s Rank correlation co-efficient = 0.6, p = 0.001. CFSE carboxyfluorescein diacetate succinimidyl ester, PBMC peripheral blood mononuclear cells.

