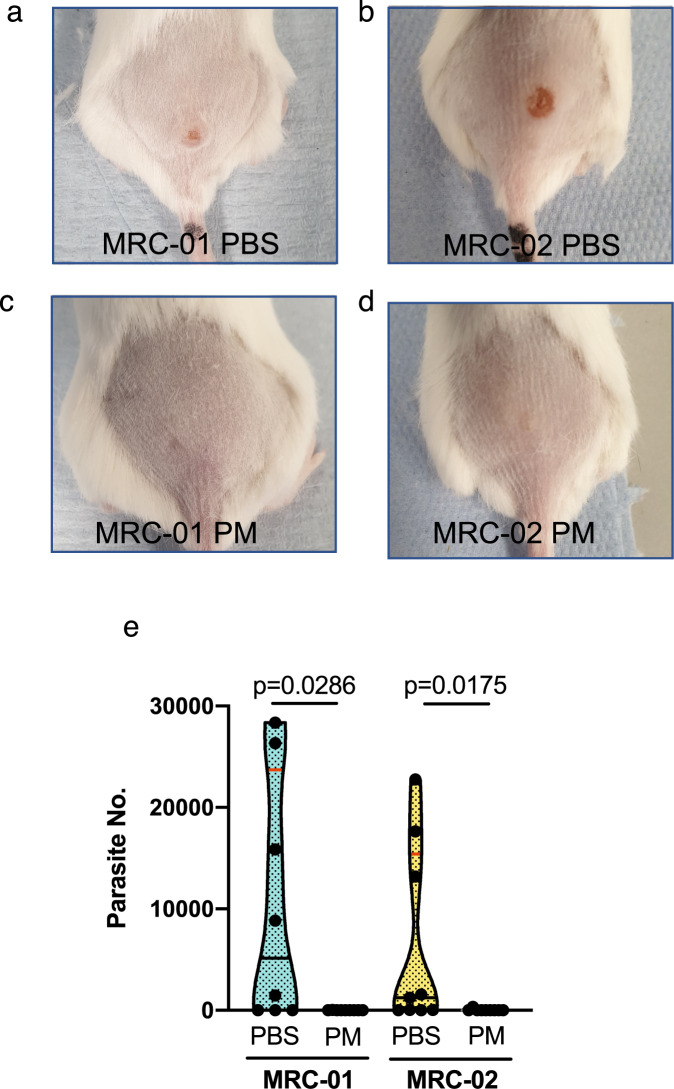
Fig. 4. Response of BALB/c mice infected with L. major MRC-01 and L. major MRC-02 to paromomycin treatment.
Representative photographs of BALB/c mice infected with L. major MRC-01 (a, c) and L. major MRC-02 (b, d) in absence of treatment (a, b) and at the end of 10 days paromomycin treatment (c, d). e Parasite loads in lesions of mice treated with paromomycin (PM) or vehicle (PBS), as determined by qPCR. Data are derived from two independent experiments with 9 mice per group for L. major MRC-02 with and without treatment and L. major MRC-01 with treatment and n = 8 mice for L. major MRC-01 without treatment. Data are shown as violin plots truncated at the max/min values, with median (black line) and quartiles (red line) and individual data points indicated. Data comparing with and without treatment were analysed using a two-sided Mann–Whitney test, with p values as indicated. Source data are provided as a Source data file.

