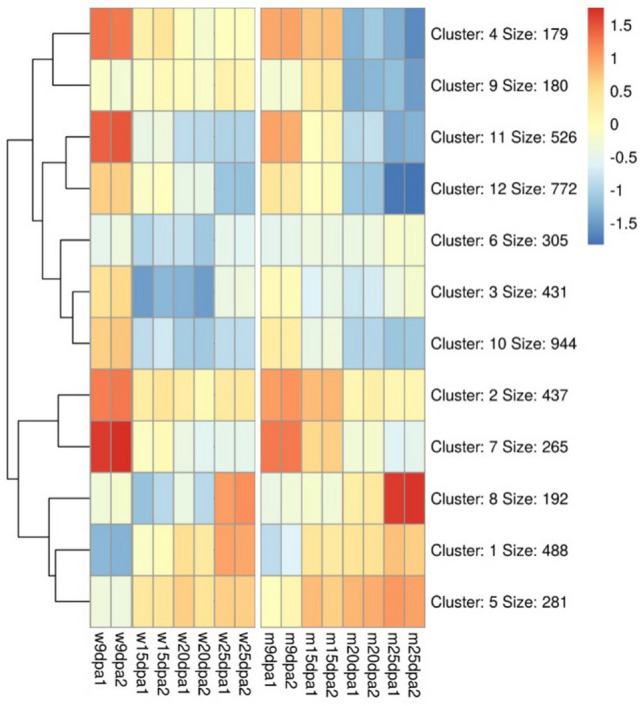
Fig. 4.

Heatmap for k-means clusters of DEGs in WT and SM482gs mutant at the four developmental stages. The color gradient from blue to red indicates down- and upregulation (see the colored bar). The “size” indicates the number of DEGs in the cluster
