Fig. 6.
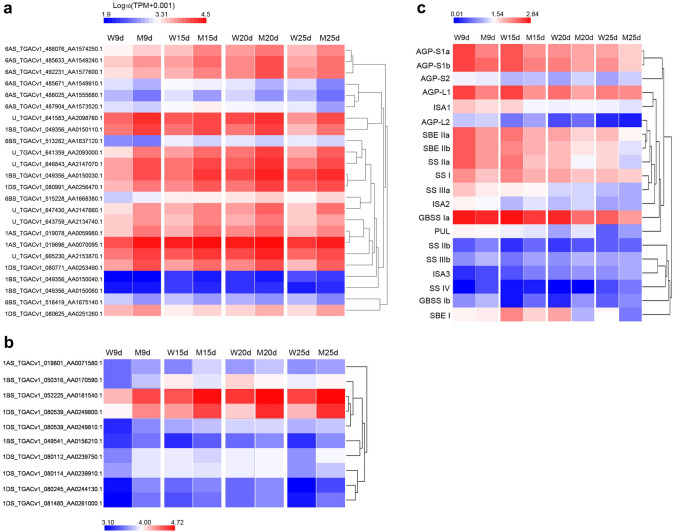
Expression patterns of SSP and starch biosynthesis genes in the four grain developmental stages of WT and SM482gs. a Comparison of gliadin protein-encoding genes. b Comparison of LMW-GS genes. c Comparison of starch biosynthesis-related genes. W: WT, M: SM482gs mutant. The color bar represents log10(TPM + 0.001)-transformed TPM values for each gene. Red and blue colors indicate high and low expression, respectively. The gene names of (a) and (b) are the transcript IDs of the Ensembl database

