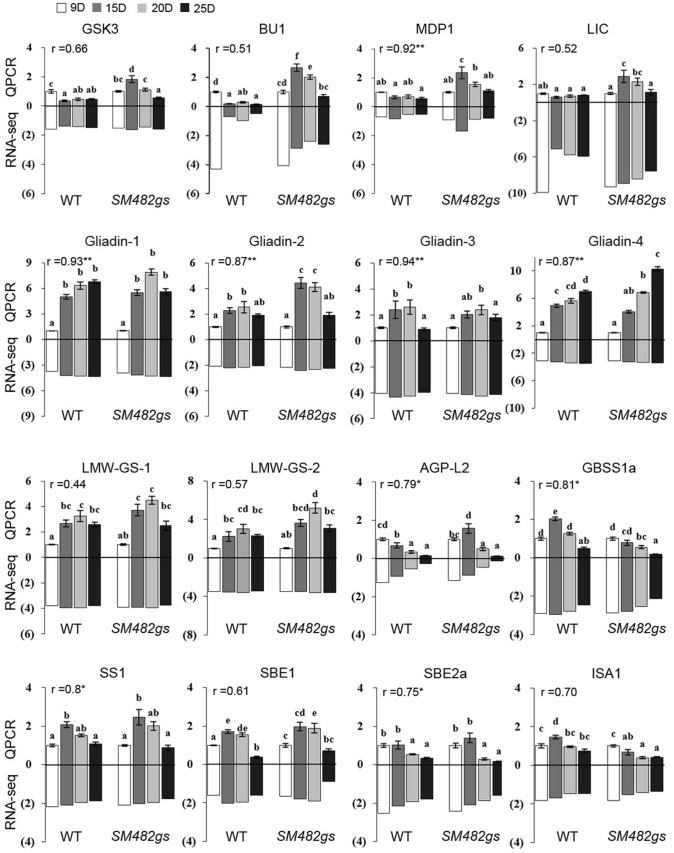
Fig. 7.
Validation of 16 candidate genes in WT and SM482gs by RT-qPCR and RNA-seq. The gene numbers (Gliadin 1–4, LMW-GS 1–2) correspond to the gene ID in Supplemental Table S3. The data of RT-qPCR are means ± SDs, n = 3, and different letters indicate significant differences between samples at p < 0.05. The RNA-seq values are log10(TPM + 0.001)-transformed TPM values for each gene. The correlation coefficient (r) for each gene between the RT-qPCR and RNA-seq is shown with the significance level of *p < 0.05

