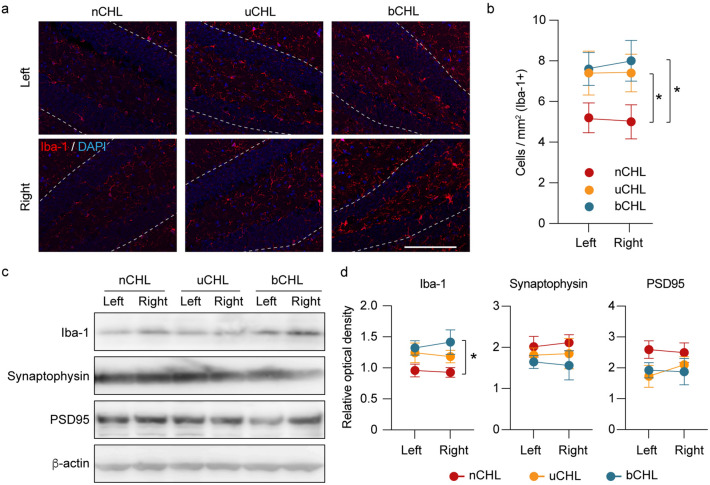
Figure 4.
Iba-1 immunohistochemistry of the hippocampus and western blot analysis one week after ear occlusion. (a) Representative micrographs of hippocampus in DG stained for Iba-1 one week after ear occlusion. Scale bar indicates 100 μm. (b) Significant differences in the number of Iba-1-positive cells in both ears among the groups of mice were observed. No significant differences were detected between the right and left DG across groups. (c) Representative western blots for Iba-1, synaptophysin, and PSD95 one week after ear occlusion. (d) The expression levels of Iba-1 in uCHL and bCHL mice were upregulated one week after ear occlusion. Specifically, expression levels of Iba-1 in bCHL mice were significantly upregulated (n = 3 for each group). β -actin served as control for protein loading. *p < 0.05. DG, dentate gyrus.

