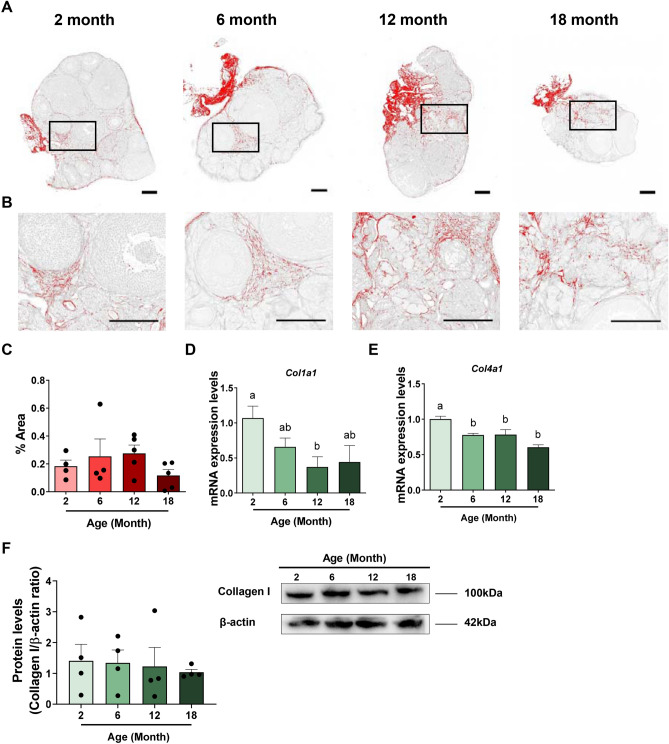
Figure 2.
Evaluation of ovarian fibrosis during reproductive ageing. (A) Representative processed color threshold images of PicroSirius Red (PSR)-stained ovarian tissue sections used to quantify fibrosis in 2, 6, 12 and 18-month-old mice. (B) Higher magnification images from specific regions boxed in ovaries from 2, 6, 12 and 18-month-old mice. Scale bars are 200 μm. (C) Percentage of PSR-positive staining in ovaries from 2, 6, 12 and 18-month-old mice. n = 4–5 per cohort. Gene expression levels of Col1a1 (D) and Col4a1 (E) in ovaries from 2, 6, 12 and 18-month-old mice. n = 4–6 per cohort. (F) Quantification and representative image of ovarian protein levels of collagen I from 2, 6, 12 and 18-month-old mice. n = 4 per cohort. Data are presented as mean ± SEM; C: Kruskal–Wallis test, Dunn’s multiple comparisons test (p > 0.05). (D,E,F): Ordinary One-way ANOVA, Tukey’s multiple comparisons test: a and b are significantly different among groups (p < 0.05). Each dot represents one animal.

