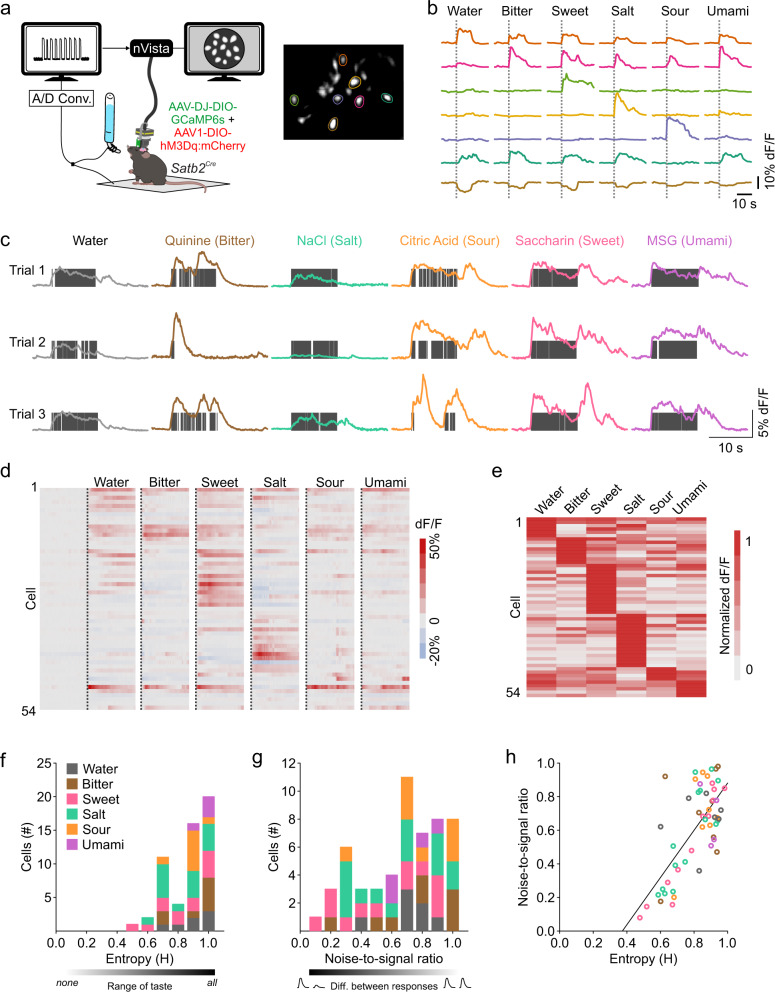
Fig. 2. Satb2 neurons respond to taste stimuli.
a Satb2Cre mice were unilaterally injected with AAV-DJ-DIO-GCaMP6s and AAV1-DIO-hM3Dq:mCherry into the PBN calcium signals were visualized with an implanted GRIN lens. b Responses to multiple taste stimuli from cells highlighted in a. c Example responses to multiple tastes from a single neuron across three recording trials in the same day. Vertical gray bars represent licks. d Heat map of all 54 cells recorded showing responses of each cell during licking across six different stimuli, arranged in order of best-stimulus categories and in descending order of normalized average response magnitude to the best stimulus (n = 3 mice). Dotted line represents first lick. e Absolute value of the average response of Satb2 neurons in d, normalized to the number of licks. f Distribution of entropy values for all neurons recorded colored by their best average response. g Noise-to-signal ratios of responses for all neurons. h Correlation between entropy and noise-to-signal ratio for each neuron. Source data are provided as a Source Data file.

