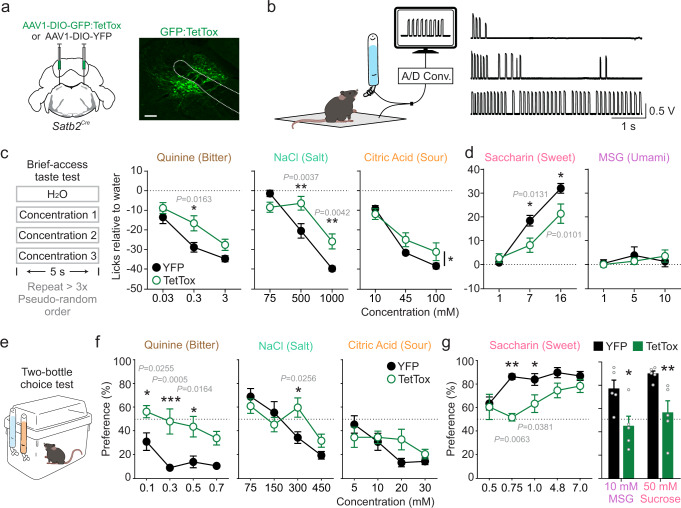
Fig. 3. Inactivation of Satb2 neurons attenuates innate taste preferences and aversions.
a Satb2Cre mice injected with AAV1-DIO-GFP:TetTox or AAV1-DIO-YFP and representative image of viral expression, similar levels of expression were verified in all TetTox mice used. Scale bar, 100 µm. b Mice were water restricted and given brief access to water and three concentrations of a taste solution. Example recordings of licks for different concentrations of a taste stimulus are shown. c In brief-access tests, TetTox mice licked more for quinine, NaCl and citric acid solutions than control mice (two-way repeated-measures (RM) ANOVA; quinine: YFP=9, TetTox n = 5, group effect F(1,12) = 5.658, P = 0.0310; NaCl: YFP n = 9, TetTox n = 6, interaction F(2,26) = 11.6, P = 0.0003; citric acid: YFP n = 9, TetTox n = 6, interaction F(2,26) = 4.806, P = 0.0167). d TetTox mice licked less for different concentrations of saccharin but not MSG (two-way RM ANOVA; saccharin: YFP n = 8, TetTox n = 6, interaction F(2,24) = 6.586, P = 0.0052; MSG: YFP n = 9, TetTox n = 7; interaction F(2,28) = 1.104, P = 0.3455). e Mice underwent 48-h, two-bottle choice tests, with the option of water or a taste solution. f TetTox mice decreased avoidance of quinine and NaCl, but not citric acid (two-way ANOVA; quinine: YFP n = 7–14, TetTox n = 7–10, group effect F(1,66) = 36.96, P < 0.0001; NaCl: YFP n = 7–13, TetTox n = 6–11, interaction F(3,62) = 3.378, P = 0.0237; citric acid: YFP n = 9–14, TetTox n = 7–11, interaction F(3,70)=1.673, P=0.1807). See exact n in Supplementary Table 1. g TetTox mice in 48-h tests also had a decreased preference for saccharin, sucrose, and MSG compared to control mice (saccharin: two-way ANOVA, YFP n = 8–11, TetTox n = 4–10, group effect F(1,72) = 17.73, P; sucrose and MSG: multiple unpaired two-tailed t tests, n = 5 mice per group; sucrose: t(16) = 2.979, P = 0.0089; MSG: t(16) = 2.857, P = 0.0114). All post hoc analyses used Holm–Sidak’s multiple comparison test with *P < 0.05, **P < 0.01, and ***P < 0.001. Data are presented as mean ± SEM. Source data are provided as a Source Data file.

