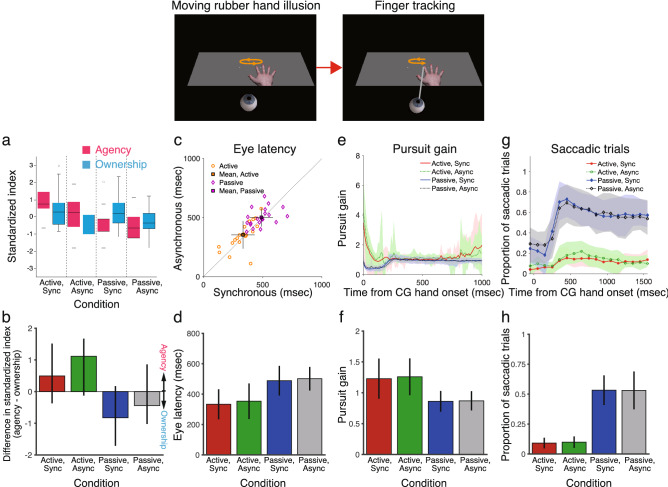
Figure 2.
Results of experiment 1. (a, b) Strength of the rated ownership and agency of the computer graphics (CG) hand shown as box-and-whisker plots for the four conditions. The ownership and agency indexes were defined as the difference in ratings between the illusion and control questions. (a) The standard score (z-score) was calculated for each of the ownership (blue) and agency (pink) indexes, which were defined as the standardized index. Horizontal black bars represent medians, and the boxes denote the interquartile ranges. Whiskers extend to the farthest data points within 1.5 times the interquartile range from the top and bottom edges of the boxes. Individual open circles represent outliers. (b) The standardized ownership index was subtracted from the standardized agency index. Colored bars represent the medians, and the error bars represent the interquartile ranges. (c, d) Eye latency, as defined by eye onset time relative to CG hand onset time. Orange and purple symbols represent the active and passive hand movement conditions, respectively, for individual participants. Square symbols represent the mean ± standard deviation. (e, f) Pursuit gain, defined as eye velocity divided by CG hand velocity after excluding saccades in velocity traces. (e) Shaded areas represent standard deviation. (f) Shows the average pursuit gain in the range of 0 to 1000 ms. (g, h) Proportion of saccadic trials in the range of − 200 to 1600 ms from CG hand onset. Results are the mean ± standard deviation in Figs. 2d–h (n = 20).

