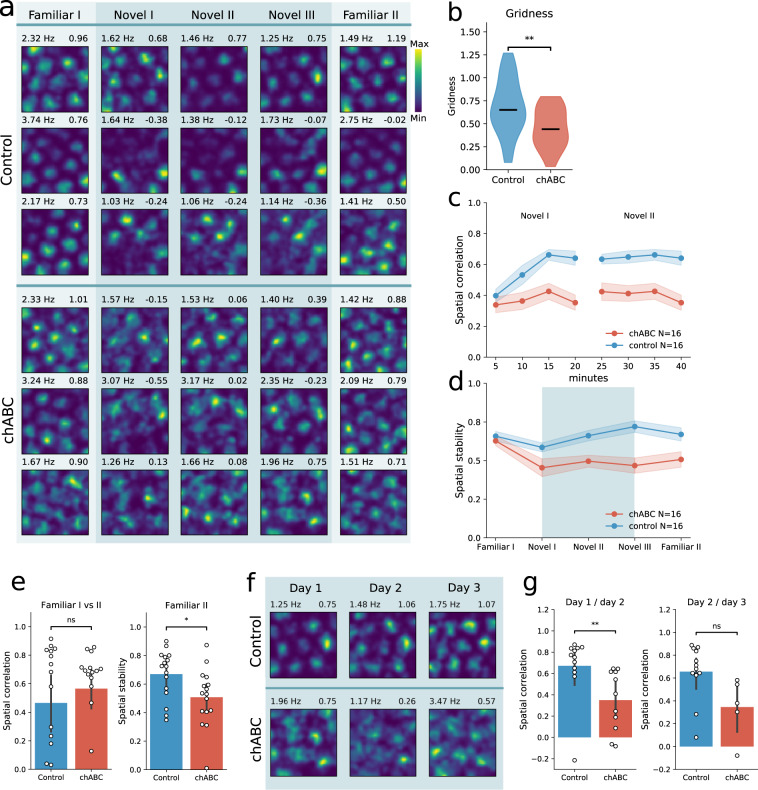
Fig. 3. Reduced grid cell stability in novel environment.
a Rate maps of five consecutive 20 min recording sessions from six individual grid cells, recorded in control animals (top) and chABC animals (bottom) during a novel environment experiment. Color code indicates spike rate. Rows correspond to individual units and columns correspond to environment. Maximum spike rate (left) and gridness (right) is denoted above each rate map. b Gridness score is reduced in the novel environment in animals treated with chABC (median (n); Control 0.65 (35); chABC 0.44 (24); p = 0.004, U = 606, Mann–Whitney U test (two sided)). c Spatial correlation measured for blocks of 5-min recordings in the novel environment sessions I and II, measured against the novel environment session III. Only units reaching gridness threshold in Familiar I and that could be identified in all five recording sessions were included. Animals treated with chABC showed reduced spatial correlations in the novel environment (mean ± s.e.m.; Control 0.59 ± 0.03; chABC 0.37 ± 0.04; main effect of group: F(1, 30) = 14.22, p = 0.0007; interaction: F(7, 210) = 4.905, p < 0.0001, Control n = 16; chABC n = 16, two-way repeated measures ANOVA with group and time as factors). Points indicate mean; shaded area represents s.e.m. d Spatial stability of the same units as in c, measured by the within-trial spatial correlation of grid cell rate maps (0–10 min correlated with 10–20 min). Points indicate mean; shaded area represents s.e.m. Spatial stability decreased from Familiar I to Novel I in the chABC-treated group, but not in the control group (median; Control Familiar I 0.67; Control Novel I 0.54, p = 0.086; chABC Familiar I 0.65; chABC Novel I 0.45, p = 0.015, Mann–Whitney U test (two sided)). e Spatial stability was similar for both groups in Familiar I (median; Control 0.67; chABC 0.65, p = 0.629). After exploring the novel environment, chABC animals showed reduced spatial stability upon returning to the familiar environment (Familiar II) (median; Control 0.72; chABC 0.53, p = 0.018, Control n = 16; chABC n = 16, Mann–Whitney U test). f Rate maps of two grid cells when introduced to the novel environment for three consecutive days. g Spatial correlation of grid cells from chABC-treated animals was decreased in the novel environment when comparing day 1 with day 2 (median; Control 0.76, n = 12; chABC 0.41, n = 11, p = 0.004, Mann–Whitney U test (two sided)). Rate map from the third novel session (Novel III) on the first day was used for correlations with day 2. n.s. = not significant, *p < 0.05, **p < 0.01. Source data are provided as a Source Data file.

