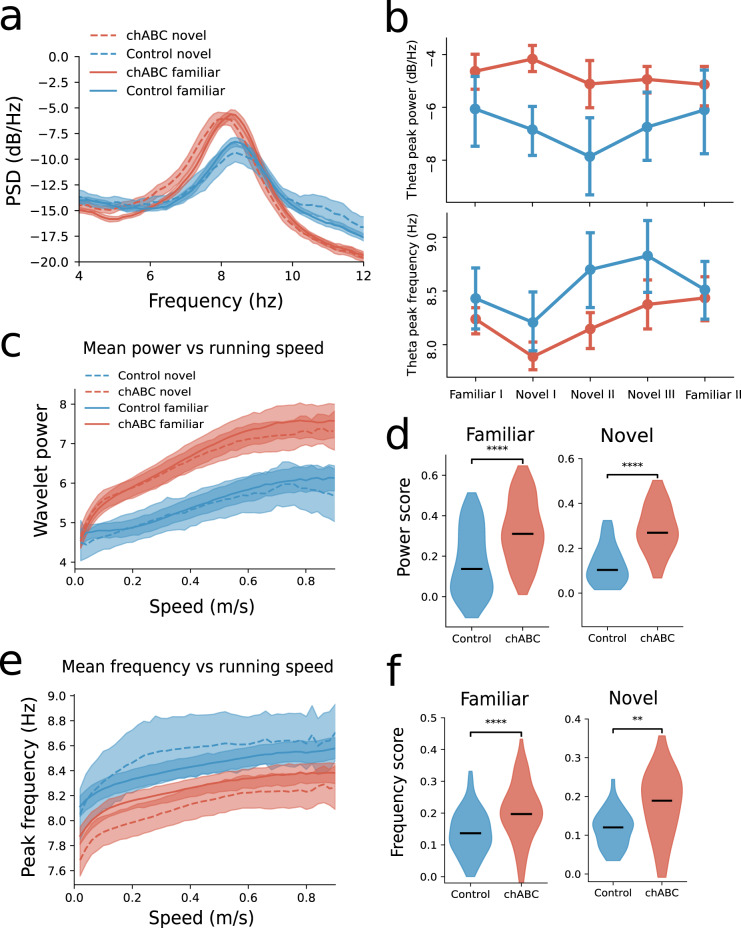
Fig. 4. Changes in theta oscillations after PNN removal.
a Power spectrum of local field potential in MEC shows that theta oscillations in chABC rats have increased power (dB/Hz) (median; Control familiar 6.12; chABC familiar 4.18; Control novel 7.17; chABC novel 4.8) and lower peak frequency (median; Control familiar 8.39; chABC familiar 8.27; Control novel 8.39; chABC novel 8.09) (solid line: familiar, dotted line: novel, blue: control, red: chABC). Shaded area represents 95% confidence interval. b Mean theta frequency for all animals during recordings in familiar and novel environments (dark colored line). Note the decrease in theta frequency during first exposure to a novel environment in both groups. Dots indicate mean; error bars represent bootstrapped 95% confidence interval. c The mean theta power was similar when the animal was immobile, but the chABC group showed increased theta power during movement. d Power score shows increased correlation between theta power and running speed in animals treated with chABC for both familiar and novel environments (median familiar; Control 0.14 (n = 148 recording sessions); chABC 0.31(n = 75) (U = 2800, p < 0.0001). Novel; Control 0.10 (n = 33); chABC 0.27 (n = 24) (U = 102, p < 0.0001)). e Theta frequency increased slightly with running speed in both groups, but the peak frequency was lower in the chABC-treated group. f Frequency score shows increased correlation between theta frequency and running speed in chABC-treated animals for both familiar and novel environment (median familiar; Control 0.14 (n = 148); chABC 0.20 (n = 75) (U = 3100, p < 0.0001). Novel; Control 0.12 (n = 33); chABC 0.19 (n = 24) (U = 200, p = 0.002)). Number of animals: Control n = 7, chABC n = 7. Mann–Whitney U test (two sided) **p < 0.01, ****p < 0.0001. Source data are provided as a Source Data file.

