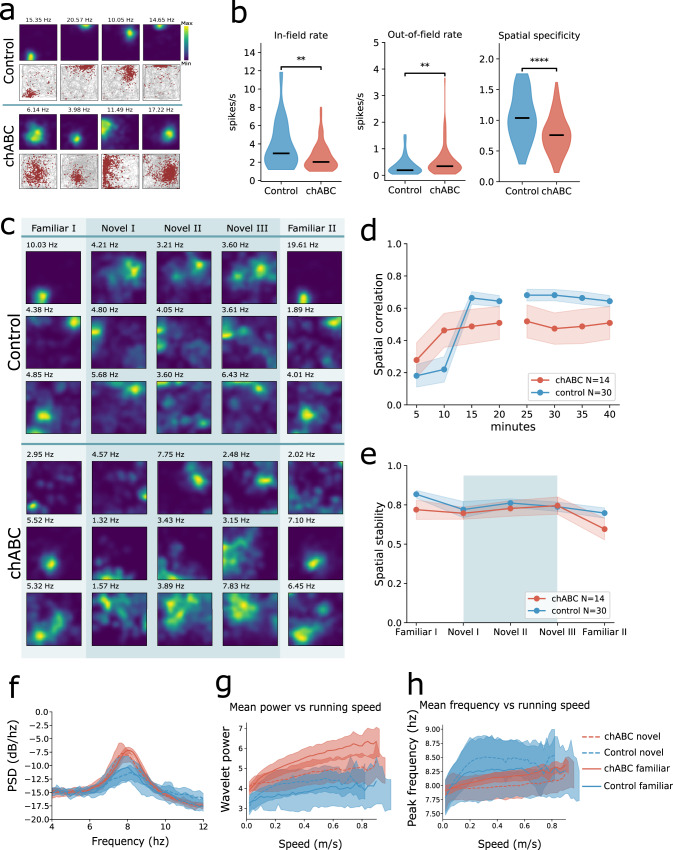
Fig. 7. Altered hippocampal place code after PNN degradation in MEC.
a Examples of place cells recorded in control and chABC-treated rats. Top row: color-coded rate maps; bottom row: running path with spikes superimposed. Maximum spike rate is denoted above the rate maps. b Place cells show reduced in-field rate (median; Control 2.97; chABC 2.03, p = 0.004) and increased out-of field rate in chABC-treated rats (median; Control 0.19; chABC 0.34, p = 0.004). Violin plots show min to max and median (black line). Width of graph corresponds to number of samples for each value. **p < 0.01, ****p < 0.0001 (Mann–Whitney U test (two sided)). c Rate maps of five consecutive 20 min recording sessions during a novel environment experiment. Rows correspond to individual units and columns to environment condition. d Spatial correlation between blocks of 5 min recordings in a novel environment (Novel I and Novel II) against the last 20 min (Novel III) (mean ± s.e.m.; Control 0.65 ± 0.03; chABC 0.46 ± 0.09; main effect of group: F(1, 40) = 6.011, p = 0.0187, Control n = 30; chABC n = 14, two-way repeated measures ANOVA with group and time as factors). Points indicate mean; shaded area represents s.e.m. e Within a session the place code is stable for both groups measured as spatial correlation between first and last 10 min of the session. f The power spectral density (PSD) plot show stronger theta oscillations in chABC-treated animals (red lines) compared to control (blue lines). Lines indicate median; shaded area represent 95% confidence interval. g Mean theta power in hippocampus correlated with running speeds from familiar and novel environment recordings. h Peak theta frequency increases with running speed. Source data are provided as a Source Data file.

