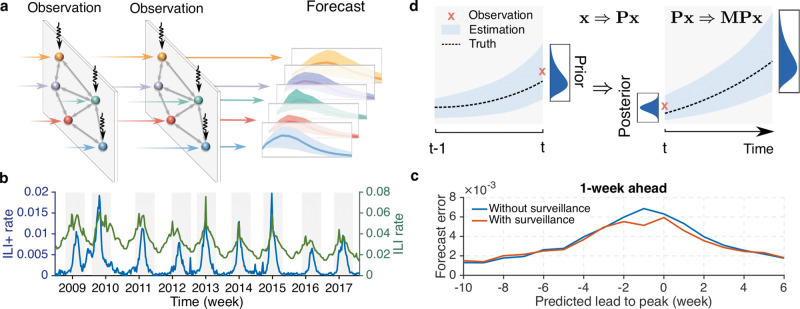
Fig. 1. The networked forecasting system and uncertainty propagation.
a Schematic illustration of the networked forecasting system. At each observation time point, incidence data from 3 locations (vertical arrows) are used to adjust the dynamical model consisting of 5 connected locations. The adjusted model is then evolved forward (horizontal arrows) to the next observation time point, and ultimately further into the future to generate a forecast. (b) The national ILI+ rate (blue line) and ILI rate (green line) for the 2008–2009 to 2016–2017 seasons from AFHSB data. Shaded areas indicate the retrospective forecasting periods. (c) Comparison of forecast error (mean absolute error) for 1-week ahead prediction with (red line) and without (blue line) surveillance data. The forecast error at each predicted lead (negative/positive: before/after predicted peak) was averaged over all 35 locations for versions with and without surveillance data. (d) Uncertainty propagation in the networked forecasting system. At time t, the prior state is updated to a posterior using available observations (red cross), which constrains the model toward the truth (dash line). The reduction of uncertainty x due to data assimilation and its growth during model integration can be approximated by x ⇒ Px and Px ⇒ MPx.

