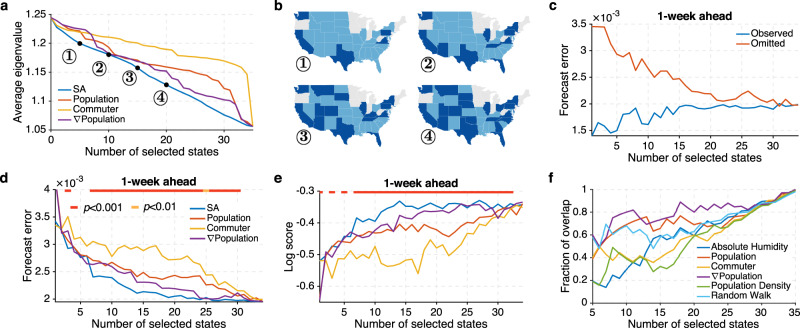
Fig. 3. Surveillance network optimization for 35 US states.
a The average eigenvalues of surveillance networks selected by SA (simulated annealing) (blue line), population (red line), commuter numbers (orange line), and population gradient (∇Population) (purple line). Four SA surveillance networks are displayed in (b). Dark blue states are selected by the SA optimization. Grey states were not included in the analysis. c Forecast error for 1-week ahead ILI+ prediction in the observed (blue line) and omitted (red line) states. Surveillance locations are selected by SA. d Forecast error for 1-week ahead ILI+ prediction using surveillance networks designed by different methods. The horizontal bar on top indicates the statistical significance for SA outperforming all other methods (two-sided Wilcoxon signed-rank test; red: p < 0.001, orange: p < 0.01, none: p ≥ 0.01). e Log score for 1-week ahead ILI+ prediction using surveillance networks designed by different methods. f Overlap between the states selected by SA and those selected by other attributes: absolute humidity (blue line), population (red line), commuter (orange line), ∇Population (purple line), population density (green line), and random walk centrality (light blue line).

