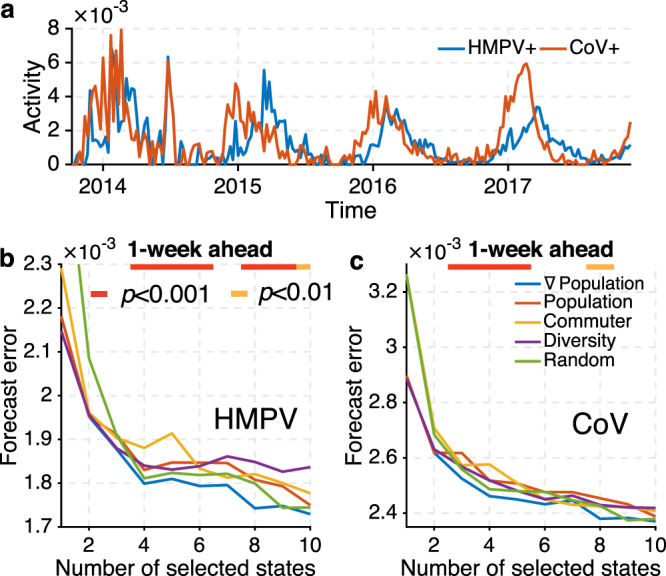
Fig. 5. Retrospective forecasts for human metapneumovirus (HMPV) and coronavirus (CoV).

a The national HMPV+ rate (blue line) and CoV+ rate (red line) for the 2013–2014 to 2016–2017 seasons from AFHSB data. Forecast errors for 1-week ahead predictions of HMPV and CoV in 35 US states from 2013 to 2017 are reported in (b) and (c). We focus on surveillance networks consisting of less than 10 states because monitoring more states only provides nominal improvement. The horizontal bar on top indicates the statistical significance for ∇Population (blue line) outperforming methods based on population (red line), number of commuters (orange line), diversity of commuters’ residential locations (purple line), and random selection (green line) (two-sided Wilcoxon signed-rank test; red: p < 0.001, orange: p < 0.01, none: p ≥ 0.01).
