Figure 5.
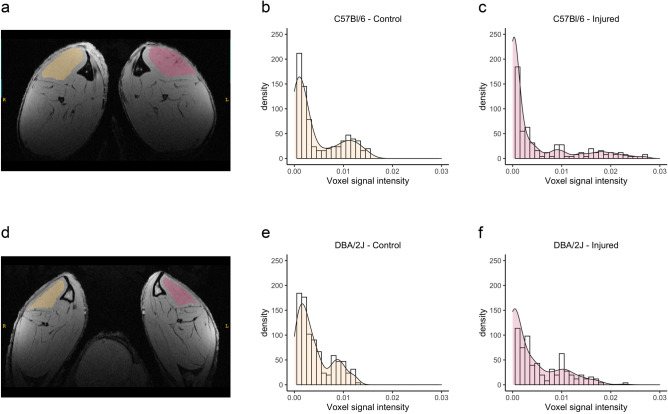
Altered signal intensity distribution in high-resolution images of injured muscles. T1-weighted high-resolution images were acquired with in-plane resolution of 50 μm and slice thickness of 200 μm. Representative high-resolution image of a C57Bl/6 (a) and a DBA/2J (d) mouse, showing the ROIs drawn over injured (red) and control (yellow) tibialis cranialis and the histograms of signal intensity in the ROIs: (b) C57Bl/6—control, (c) C57/Bl/6—injured, (e) DBA/2J—control, and (f) DBA/2J—injured. Both C57Bl/6 (c) and DBA/2J (f) histograms illustrate the higher kurtosis observed in injured muscles, with increased presence of outliers.

