Figure 3.
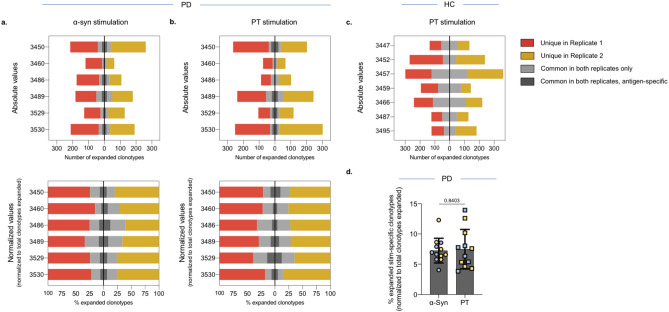
Similar numbers of expanded clonotypes in response to α-syn and PT stimulation. The number of expanded clonotypes in α-syn- and PT-stimulated PD (a, b) and HC (c) samples. For PD both absolute numbers (top) and normalized against total number of clonotypes in each replicate (bottom) is shown. Red indicates clonotypes that are unique in replicate 1, yellow indicates clonotypes that are unique in replicate 2. Grey indicates clonotypes that are common between the two replicates (− log2 OR > 1 and FDR p val < 0.05) and dark grey indicates antigen-specific clonotypes, i.e., number and proportion of clonotypes that expanded only in each antigen-stimulated culture excluding clonotypes that expanded irrespective of stimuli. d Percentage of α-syn- and PT specific clonotypes in PD (dark grey in bottom graphs). Yellow (replicate 1) and blue (replicate 2). Mean ± StDev is shown. Paired two-tailed t test.

