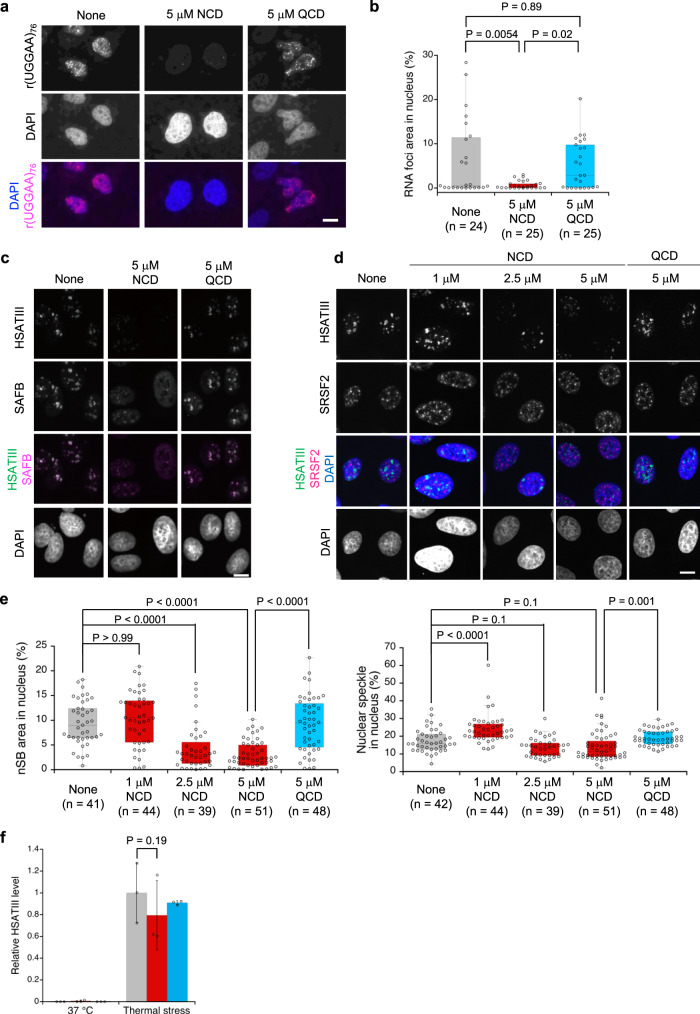
Fig. 5. The effect of NCD on RNA foci and nSB assembly.
a RNA FISH images of cells expressing r(UGGAA)76 in the absence (left) and presence of NCD (middle) and QCD (right). Ligand concentration was 5 μM. Scale bar, 10 μm. (n = 3, independent experiments). b Box plots of total area of r(UGGAA)76 RNA foci in each nucleus (n = the analyzed cell number). p-value (Kruskal–Wallis test, followed by Dunn’s multiple comparison test, two-sided) was shown above. c, d RNA FISH and IF images of HeLa cells after thermal stress exposure in the absence and presence of NCD (1, 2.5, and 5 μM) or QCD (5 μM) stained by HSATIII-FISH and IF using an anti-SAFB (c) and anti-SRSF2 (d) antibodies. Scale bar: 10 μm. (n = 3 for c and 2 for d, independent experiments). e Box plots of total area of nSBs (left) and nuclear speckles (right) in each nucleus (n = the analyzed cell number). p-value (Kruskal–Wallis test, followed by Dunn’s multiple comparison test, two-sided) was shown above. f RT-qPCR analysis of HSATIII RNA level. HeLa cells were cultured at 37 °C for 3 h (left; 37 °C) or at 42 °C for 2 h followed by recovery at 37 °C for 1 h (right; thermal stress) in the absence (gray) and presence of 5 μM NCD (red) or QCD (blue). Data are shown as the mean ± SD (n = 3 independent experiments); (Dunnett’s multiple comparison test, two-sided). Box plots in b and e show median (center line), upper and lower quartiles (upper and lower box limits), upper quartiles +1.5× interquartile range (upper whiskers), and lower quartiles –1.5× interquartile range (lower whiskers). Source data are provided as a Source Data file.

