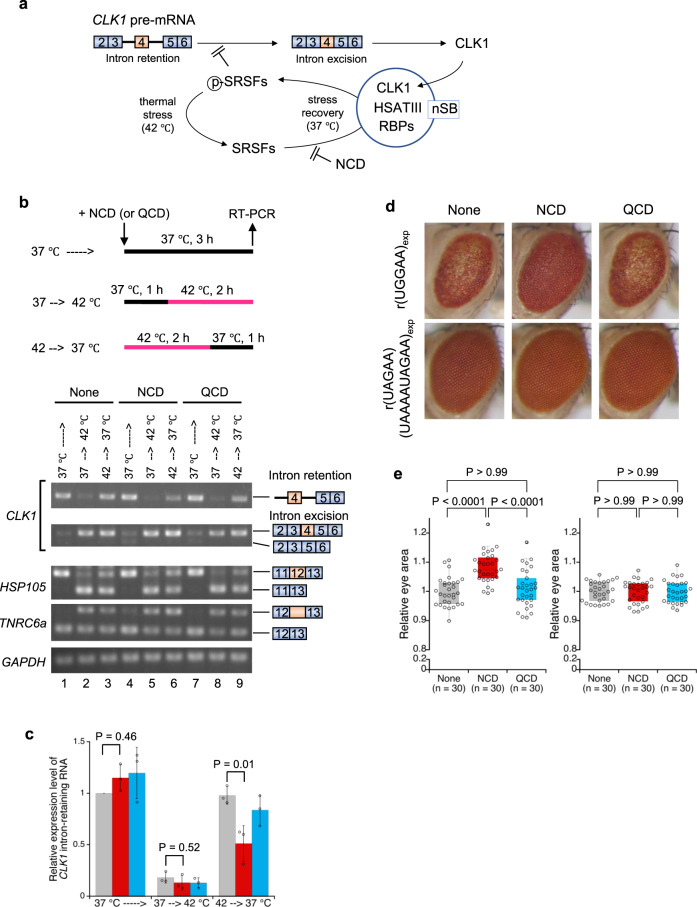
Fig. 6. Biological activity of NCD in splicing and SCA31 disease models.
a Schematic illustration of nSB-dependent intron retention through re-phosphorylation of SRSFs. b Semi-quantitative RT-PCR analysis of CLK1 intron-retaining pre-mRNA during thermal stress recovery. The GAPDH mRNA was used as an internal control. c Relative expression level of the CLK1 intron-retaining pre-mRNA in the absence (gray) and presence of 2.5 μM NCD (red) and QCD (blue). Data are shown as the mean ± SD (n = 3 independent experiments); (Dunnett’s multiple comparison test, two-sided). d Light microscopic images of compound eyes from Drosophila expressing r(UGGAA)exp (GMR-Gal4/+; UAS-(UGGAA)exp/+) (upper, left) and r(UAGAA)(UAAAAUAGAA)exp (GMR-Gal4/+; UAS-(UAGAA)(UAAAAUAGAA)exp/+) (lower, left) with the administration of NCD (middle) and QCD (right). Ligand concentration was 100 μM. e Box plots of the eye area of Drosophila expressing r(UGGAA)exp (left) and r(UAGAA)(UAAAAUAGAA)exp (right) (n = the number of the analyzed flies). Box plots show median (center line), upper, and lower quartiles (upper and lower box limits), upper quartiles +1.5× interquartile range (upper whiskers), and lower quartiles –1.5× interquartile range (lower whiskers). p-value (Kruskal–Wallis test, followed by Dunn’s multiple comparison test, two-sided) was shown above. Source data are provided as a Source Data file.

