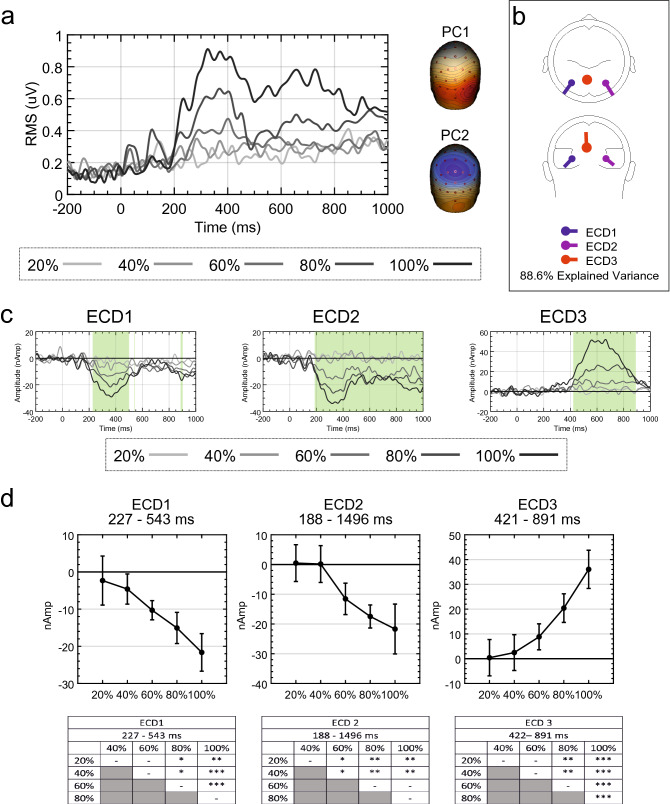
Figure 11.
Source dipole model residual variance, source waveforms and mean activity in intervals for Palumbo et al.32. (a) Residual variance GFP for each condition when including only extrastriate sources and the two principle components explaining the greatest amount of variance. (b) Final source dipole model and proportion of explained variance. (c) Source waveforms for each ECD from each condition. Significant main effects of PSYMM are highlighted in green. (d) Mean source activity averaged over latencies demonstrating significant main effects of PSYMM for each task and ECD. Results of post-hoc testing are also shown (*P < 0.05; **P < 0.01; ***P < 0.001). Scalp maps and glass brains were created using BESA 7.0 (https://www.besa.de/).

