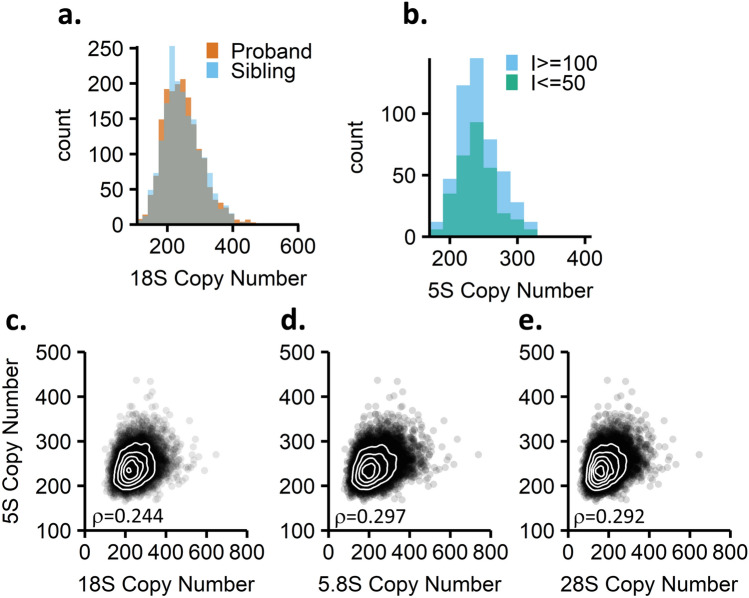
Figure 1.
rDNA copy number estimates and correlations of 45S and 5S rDNA regions in the Simons Simplex Collection. (a) rDNA copy number distributions for probands (n = 1774) and unaffected siblings (n = 1774) in the Simons Simplex Collection. Paired t-test p-value: 0.937. (b) Comparison of 18S copy number in probands with low (I < = 50, n = 298) and high (I > = 100, n = 500) IQ scores. Welch Two Sample t-test p-value = 0.01533, average difference between groups is 9 copies. (c–e) Correlations of each the 18S, 5.8S, and 28S regions of the 45S rDNA array to the 5S rDNA array with Spearman’s rho indicated (n = 7210).

