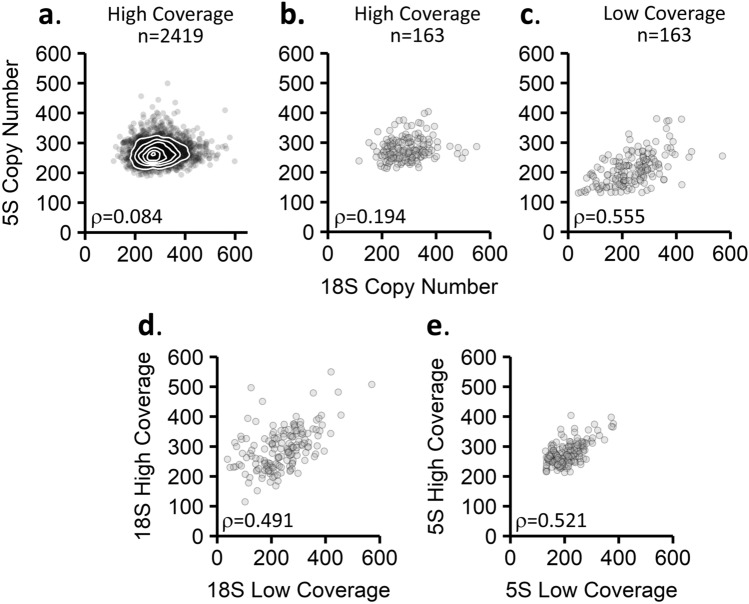
Figure 2.
Correlations of the 5S and 45S rDNA copy numbers in 1000 Genomes Project data. (a) Correlation of the 18S to the 5S in the high-coverage 1000 Genomes Project data (n = 2419). (b) Correlation of the 18S to the 5S in the subset of 1000 Genomes Project data samples also analyzed in the low-coverage dataset (n = 163). (c) Correlation of the 18S to the 5S in the low-coverage 1000 Genomes Project data (n = 163). (d,e) Comparison of rDNA copy number estimates for the same cell lines sequenced separately in the high-coverage and low-coverage 1000 Genomes datasets for the 18S locus (d) and the 5S locus (e). Spearman’s rho is indicated in each panel, n = 163.

