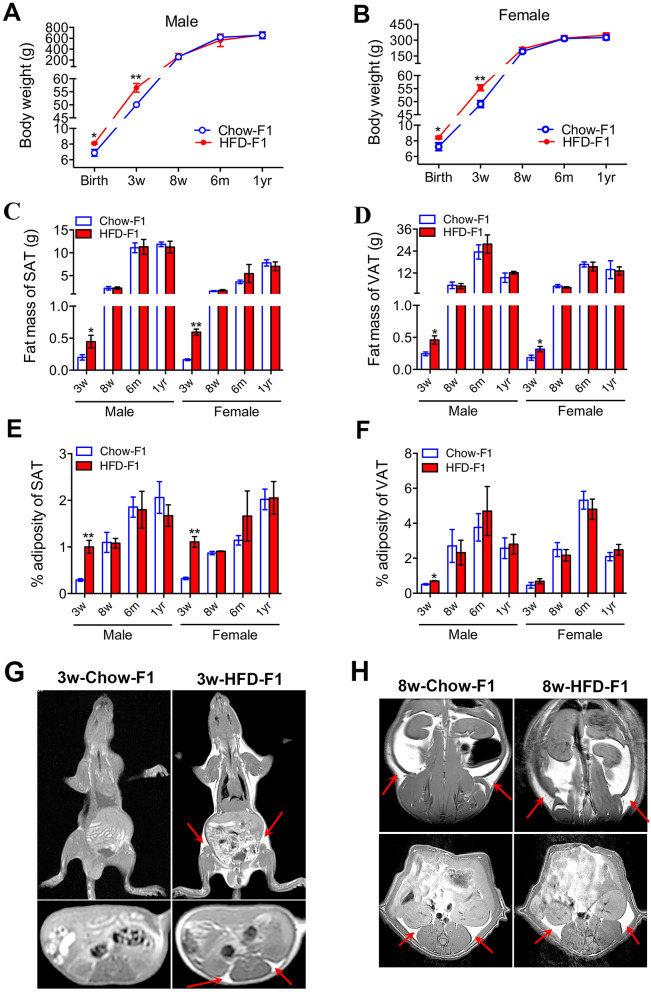
Figure 1.
Body weight and fat mass between chow-exposed and HFD-exposed rat offspring at different ages. (A) Body weights of male chow-exposed and HFD-exposed rat offspring of various ages. (B) Body weights of female chow-exposed and HFD-exposed rat offspring of various ages. (C) Fat mass of subcutaneous adipose tissue (SAT) in male and female offspring. (D) Fat mass of visceral adipose tissue (VAT) in male and female offspring. (E) % adiposity (fat/body weight) of SAT in male and female offspring. (F) % adiposity of VAT in male and female offspring. (G) T1-weighted magnetic resonance (MR) images in 3-week-old chow-exposed and HFD-exposed male rat offspring. (H) T1-weighted MR images in 8-week-old chow-exposed and HFD-exposed male rat offspring. For (A–F), values are expressed as means ± SEs, n = 6 for each group. **p < 0.01, *p < 0.05, compared to the corresponding control. For E and F, the images above were obtained in the coronal plane; the images below were obtained in the transverse section. The arrows indicate fat distribution in subcutaneous and visceral adipose tissues.

