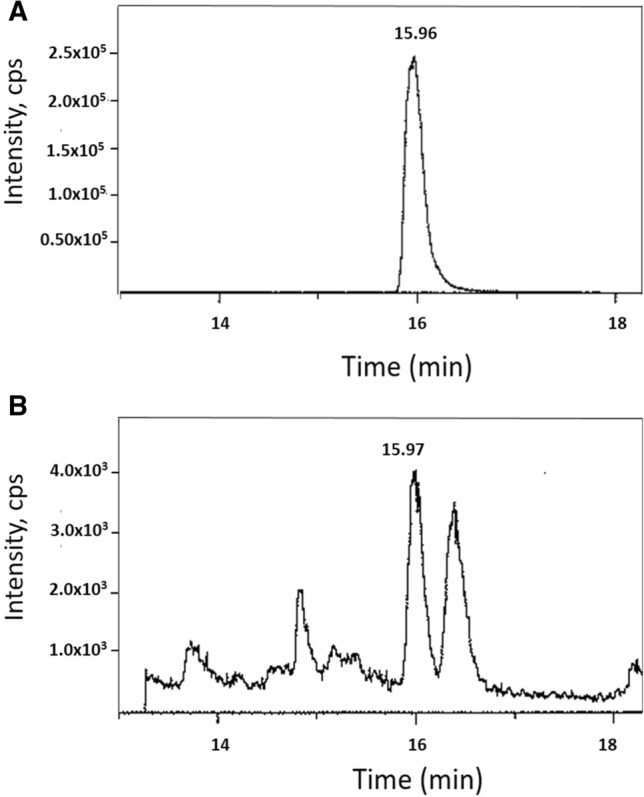
Figure 2.

LC–MS/MS analysis of 4-OXO-DHA in rat plasma. ESI negative, transition m/e = 341 → 135. Panel A represents the synthetic standard (5 ng in ethanol), while Panel B represents the detection of 4-OXO-DHA in un-spiked plasma sample from rats that received DHA. In Panel A, 4-OXO-DHA (1 mg) was dissolved in 1 ml ethanol and farther diluted to yield 1 µg/1 ml solution; 5 µl was analyzed. In Panel B, plasma sample (500–700 µl) from each rat (n = 5) mixed with 500 µl of buffer (1 M sodium acetate, pH 6) and then was extracted 3 times with 2 ml of a mixture consisted with ethyl acetate:hexane:acetic acid (75:24:1). The extract was dried over sodium sulfate, filtered and then evaporated to dryness. The residue was reconstituted in 150 µl of ethanol and 5 µl was analyzed. CPS = counts per second.
