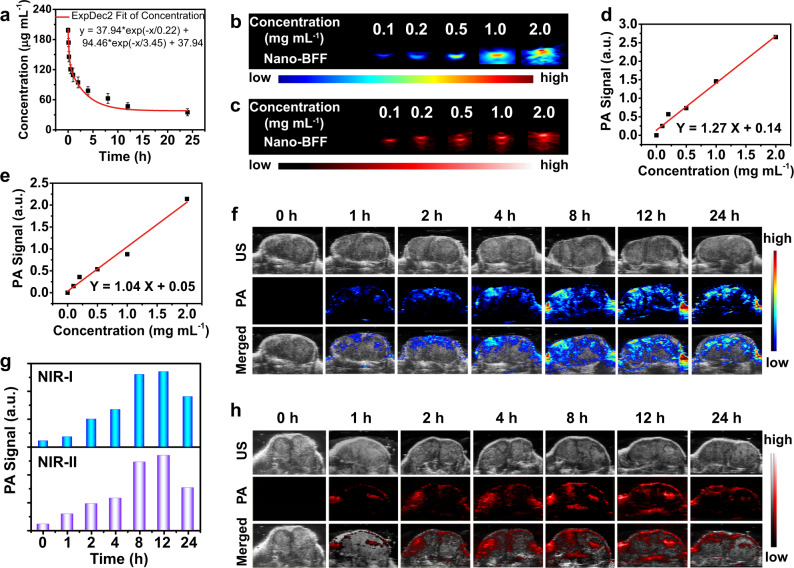
Fig. 4. In vivo pharmacokinetic analysis and PA imaging of Nano-BFF.
a Blood circulation profile of Nano-BFF after intravenous administration (n = 3 biologically independent samples). Data are presented as mean values ± SD. b, c PA images of Nano-BFF under excitation at b 900 nm and c 1200 nm at varied concentrations. d, e Plot of PA amplitudes using Nano-BFF at d 900 nm and e 1200 nm as a function of the dose of Nano-BFF. f–h In vivo PA images of tumors in the f NIR-I and h NIR-II biowindow, as well as g corresponding PA values after intravenous injection of Nano-BFF (20 mg kg−1) at various time points.

