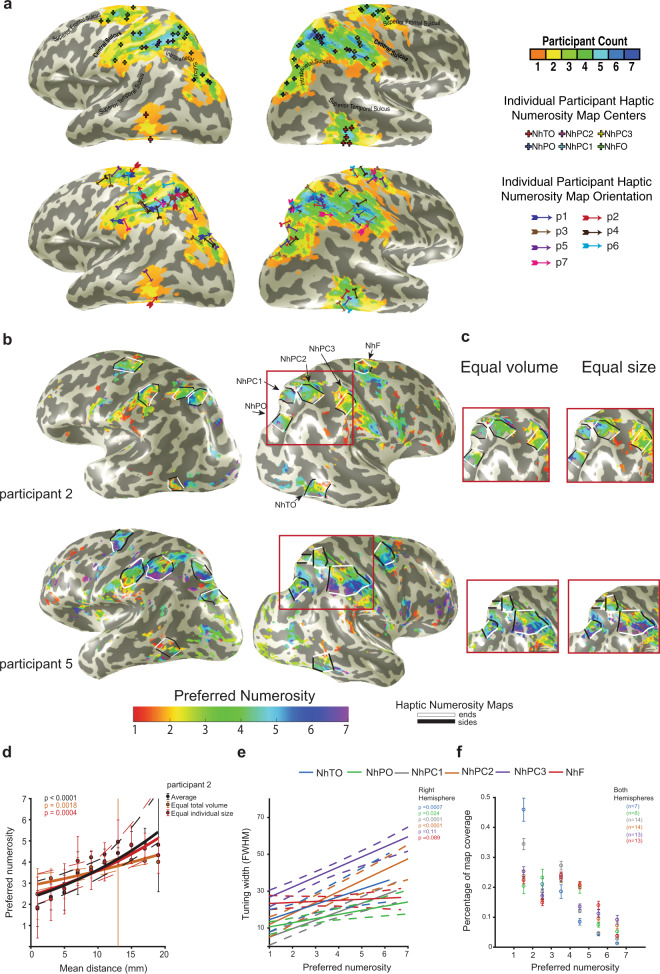
Fig. 3. Haptic-driven topographic numerosity maps.
a Haptic numerosity map locations of all participants transformed onto the N27 (Talairach) template’s cortical surface anatomy. Colors indicate the overlap between the maps of all participants. Crosses show the transformed locations of individual participants’ map centers (top). Arrows indicate the gradient’s directions of each map (bottom). b Numerosity preferences for data averaged from both haptic stimulus conditions of two example participants (variance explained > 30%). Colors represent preferred numerosity. Although only the right hand was used, several bilateral topographic maps were found consistently across participants. The borders of lowest to highest preferred numerosity in each map are marked by white lines. Black lines complete the margins of the maps. c Maps in the parietal area are shown from two example participants for each haptic stimulus condition of equal total volume and equal individual sphere size. d Preferred numerosities within NhPC1 map of participant two plotted as a function of the distance along cortical surfaces (measured between the white lines, see panel b). The preferred numerosity increases systematically and repeatably in the two stimuli configurations. Solid lines show logarithmic fits with their 95% confidence intervals (dashed lines) determined by bootstrapping (10,000 iterations). The colored text gives the probability of the observed change from permutation analysis. Error bars show the standard error of the mean for each data point. Number of recording sites across the data points: n(min) = 4, n(max) = 17, n(mean) = 11.8. e Increase in tuning widths plotted as a function of the preferred numerosity, averaged across participants. Solid lines show linear fits with their 95% confidence intervals (dashed lines) determined by bootstrapping. The text gives the probability of the observed change from permutation analysis for each map. In 4/6 maps, tuning width increased significantly with preferred numerosity. f Percentage coverage of the map plotted as a function of preferred numerosity. Grouped across participants and hemispheres, we found a decrease in cortical magnification at higher numerosities, i.e., more cortical area prefers lower numerosities. Error bars show the standard error of the mean. n indicates the number of maps that were grouped together.

