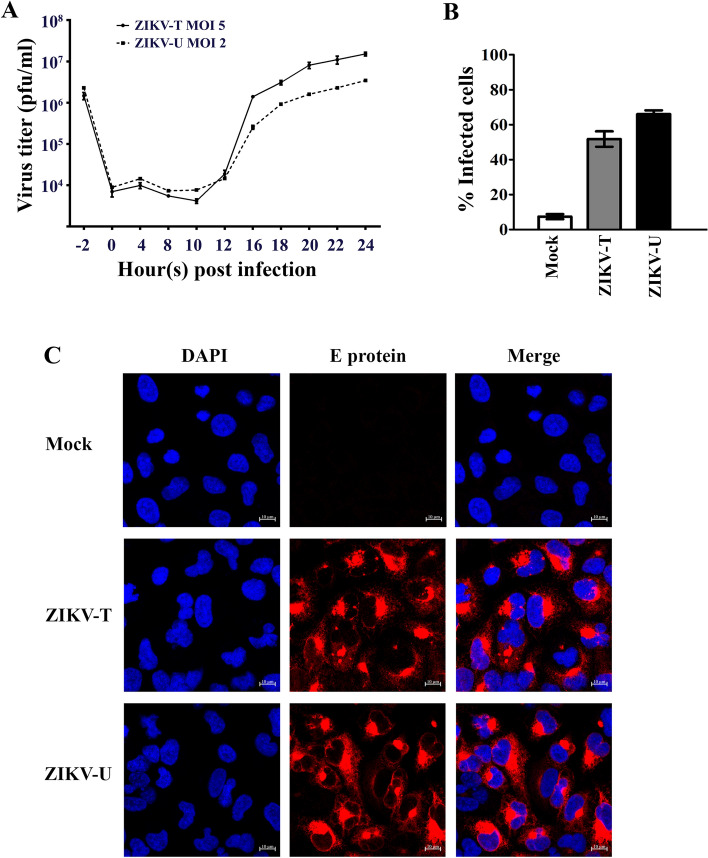
Figure 2.
Zika virus infection of A549 cells. A549 cells were mock-infected or infected with ZIKV-T or ZIKV-U at MOI 5 or 2, respectively before determining (A) the viral titer by plaque assay on Vero cells at the indicated time points post infection (p.i), with the plot showing the results of independent triplicate experiments, with duplicate plaque assay of samples, and (B) the infection levels by flow cytometry on 1 d p.i., with the plot represent means ± SEM of three independent replicates, or (C) expression of ZIKV E protein at 24 h.p.i was determined by confocal microscopy after staining using an anti-ZIKV E protein rabbit polyclonal antibody followed by a rhodamine red X-conjugated goat anti-rabbit IgG antibody (red) and DAPI (blue) for nuclei staining. Fluorescent signals were observed under a confocal microscope (ZEISS).

