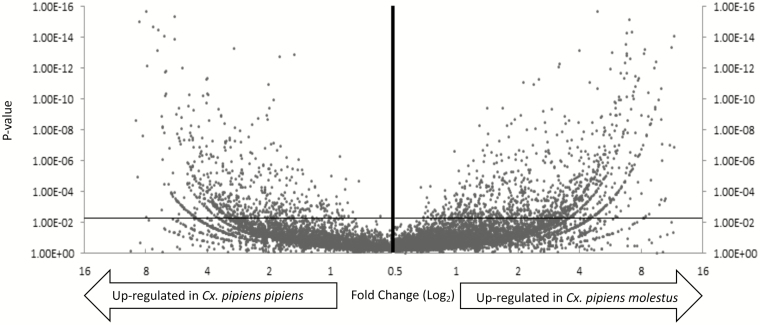
Fig. 2.
Volcano plot of Cx. pipiens molestus specific up- (right arrow) and Cx. pipiens pipiens specific up-regulated (left arrow) genes. The x-axis specifies the fold-changes and the y-axis specifies the negative logarithm to the base 10 of the t-test p-values. The horizontal line indicates the filtering criteria (P-value = 0.05)

