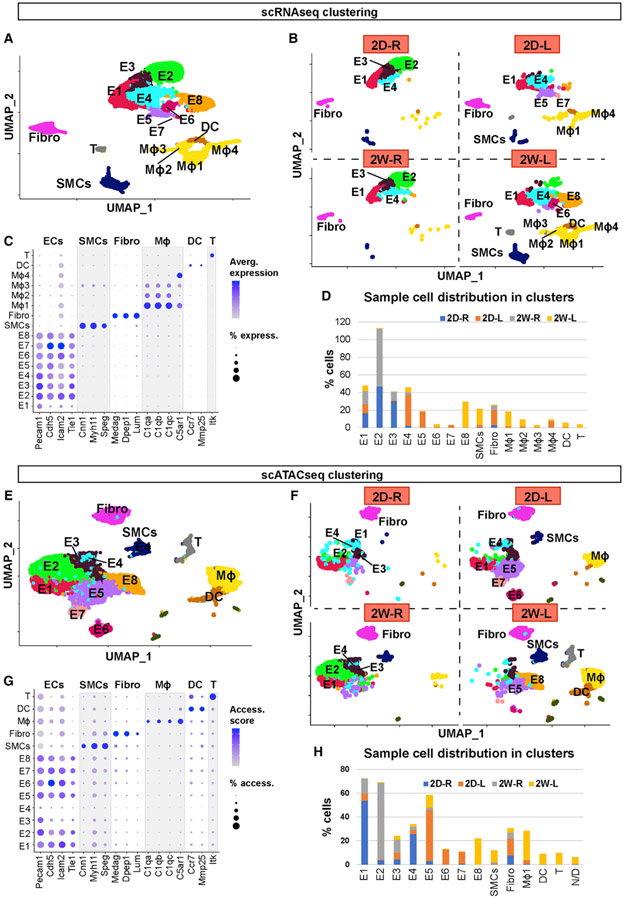
Figure 1. scRNA-Seq and scATAC-Seq Clustering and Cell Identification.
(A and B) scRNA-seq data plotted on a single UMAP representing 2D-R, 2D-L, 2W-R, and 2W-L. (A) UMAP represents all 4 samples, while (B) represents individual UMAP plots for each condition. Major cell populations include ECs (E1–8), SMCs, Fibro, macrophages, DCs, and T cells.
(C) Dot plot shows the specific marker genes used to classify each cell cluster. The percentage of cells expressing respective transcripts correlate and their expression intensity are depicted by the dot size color intensity, respectively.
(D) Graph shows the cell numbers in each cell cluster for 4 different experimental conditions.
(E and F) scATAC-seq data plotted on a single UMAP representing 2D-R, 2D-L, 2W-R, and 2W-L to identify major cell populations. (E) Single UMAP identifies major cell populations, while (F) represents individual UMAP plots for each condition.
(G) Dot plot shows the specific marker genes used to classify each cell cluster. The percentage of cells with open accessibility and the accessibility scores are depicted by the dot size and color intensity, respectively.
(H) Graph shows the cell numbers in each cell cluster for 4 different experimental conditions.

