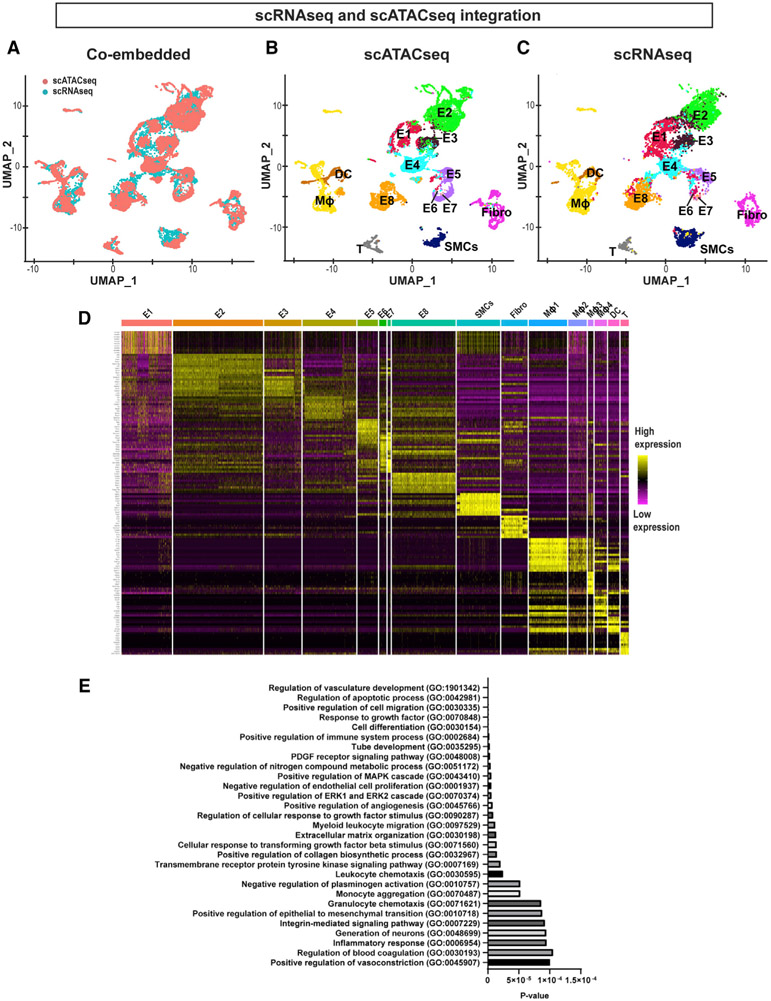
Figure 2. Integration of scRNA-Seq and scATAC-Seq Datasets, and Differential Gene Expression and Pathway Analyses.
(A) UMAP representation of the co-embedded scATAC-seq (red) and scRNA-seq (cyan) datasets. Cells from 2 assays were labeled with 2 colors as indicated in the plot.
(B and C) Individual UMAP representation of the co-embedded scATAC-seq and scRNA-seq datasets. Annotations used for the scRNA-seq shown in Figure 1A were used and superimposed onto each cell cluster.
(D) Heatmap represents the top 10 gene transcripts for each cell cluster identified from the scRNA-seq analysis.
(E) Gene Ontology analysis was performed using the top 200 upregulated genes in E8 representing the d-flow phenotype in comparison to E2 representing the s-flow phenotype. The x axis shows the p value.

