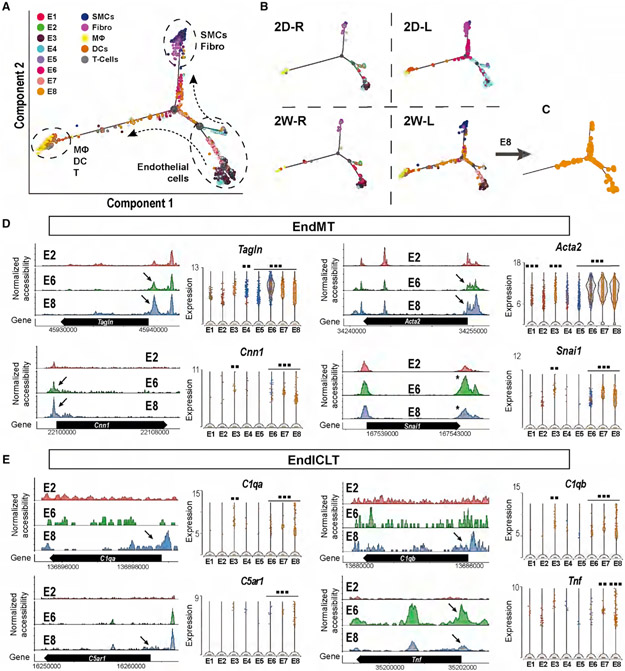
Figure 3. D-Flow Induced Endothelial-to-Mesenchymal Transition (EndMT) and Endothelial-to-Immune-like Cell Transition (EndICLT) as Shown by Pseudotime Trajectory and Accessibility Profile Analyses.
(A and B) Pseudotime trajectory plot shows differentiated cell types (ECs, SMCs, Fibro, macrophages, DCs, and T cells) at the end of the branches. Dots along the trajectory lines represent the status of the cells transitioning toward differentiated cell types. (A) All cells pooled in 4 different conditions. (B) The cells split according to the time- and flow-dependent conditions.
(C) Pseudotime Trajectory plot for E8.
(D and E) The accessibility profiles of E1 and E2, representing ECs under s-flow and E8 representing ECs under d-flow from scATAC-seq data and violin plots showing the expression of corresponding genes from scRNA-seq data. Genes representing (D) and (E) EndICLT in the EC clusters are shown. Black arrows and * indicate accessibility changes in the promoter regions and 3’UTR, respectively. **p < 0.01 and ***p < 0.001.

