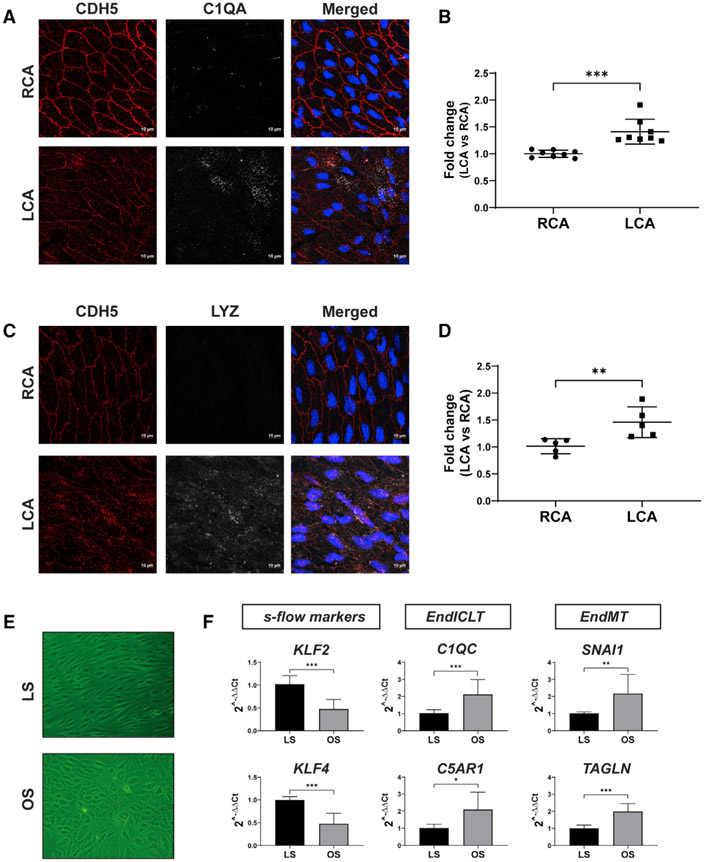
Figure 4. D-Flow Induces Expression of Immune Cell Markers in ECs In Vivo and in Cultured ECs In Vitro.
(A–D) Two weeks following PCL, the LCAs and RCAs were double-immunostained en face using antibodies for C1QA or LYZ along with the CDH5 antibody as the EC marker. Shown are confocal images for CDH5 (red), C1QA or LYZ (white), either individually or merged with nuclear DAPI (blue). The imaging intensity of each was quantified, and the data represent the mean ± SD (n = 8). **p < 0.01 and *** p < 0.001. Scale bars are shown in A and C.
(E and F) HAECs exposed to chronic laminar shear (LS mimicking s-flow) or oscillatory shear (OS, mimicking d-flow) for 1 week were analyzed by qPCR to quantify expression of immune cell markers (C1QC, C5AR1), EndMT markers (SNAI1 and TAGLN), and the flow-sensitive gene markers (KLF2, KLF4). The data represent the mean ± SD (n = 3). *p < 0.05, **p < 0.01, and ***p < 0.001.

