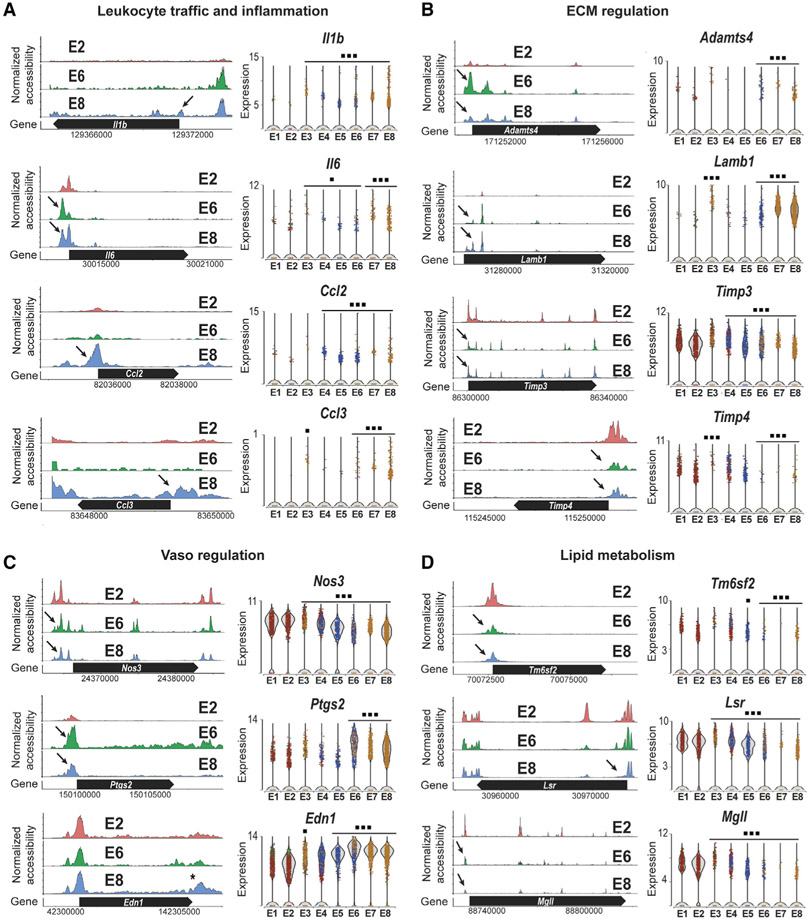
Figure 5. Chronic d-Flow Reprograms Endothelial Functions.
The accessibility profiles of E1 and E2 (s-flow) and E8 (d-flow) from scATAC-seq data and violin plots showing the expression of corresponding genes from scRNA-seq data are shown. Genes representing (A) leukocyte traffic and inflammation and (B) ECM regulation, (C) vasoregulation, and (D) lipid metabolism in the EC clusters are shown. Black arrows indicate accessibility changes in the promoter region except for Edn1 (*). *p < 0.05 and ***p < 0.001.

