Figure 1.

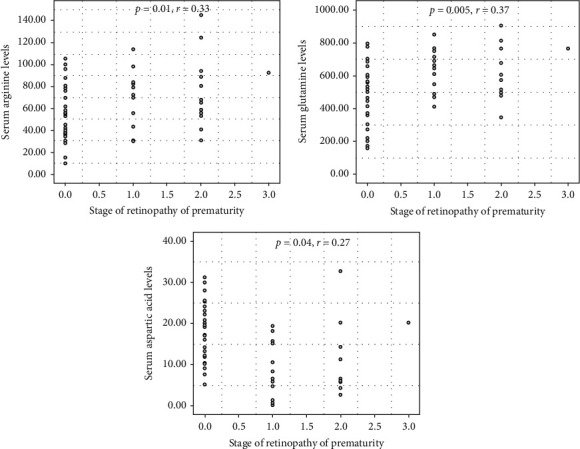
The scatter plots indicate a significant correlation between the stage of ROP and serum arginine, glutamine, and aspartic acid levels.

The scatter plots indicate a significant correlation between the stage of ROP and serum arginine, glutamine, and aspartic acid levels.