Figure 6.
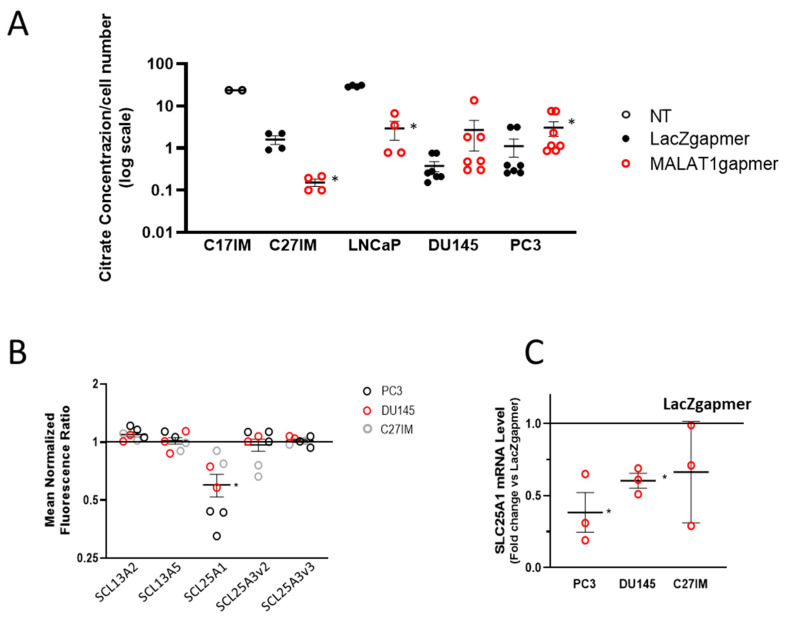
Evaluation of MALAT1 targeting on citrate production and expression of solute carrier transporters. (A) Citrate concentration analysis by colorimetric assay in the extracellular medium and normalized to cell number (106 cells) of normal/benign hyperplastic lesion-derived cells (C17IM) used as reference control or PCa cells (C27IM, LNCaP, DU145, and PC3) analyzed before/after MALAT1 targeting. Results are plotted as individual values (n = 4–7) with mean ± SEM. (B) Citrate transporters genes emerging from transcriptomic analysis before/after MALAT1 depletion in C27IM, DU145, and PC3 cells. Transcript levels of SLC13A2, SLC13A5, SLC25A1, SLC13A3 variant 2 (SCL13A3v2), and SLC13A3 variant 3 (SCL13A3v3) are expressed as fold change vs. LacZgapmer (mean ± SEM are showed). (C) SLC25A1 expression level validated in different PCa cells (PC3, DU145, and C27IM) transfected with specific gapmer for MALAT1 or LacZ. Results are plotted as fold change vs. LacZgapmer (placed to 1 and depicted as a black line). Individual values (n = 3) with mean ± SEM are shown. Non-parametric paired two-tailed Student’s t-test determined statistical significance. * p ≤ 0.05 MALAT1gapmer vs. LacZgapmer.

